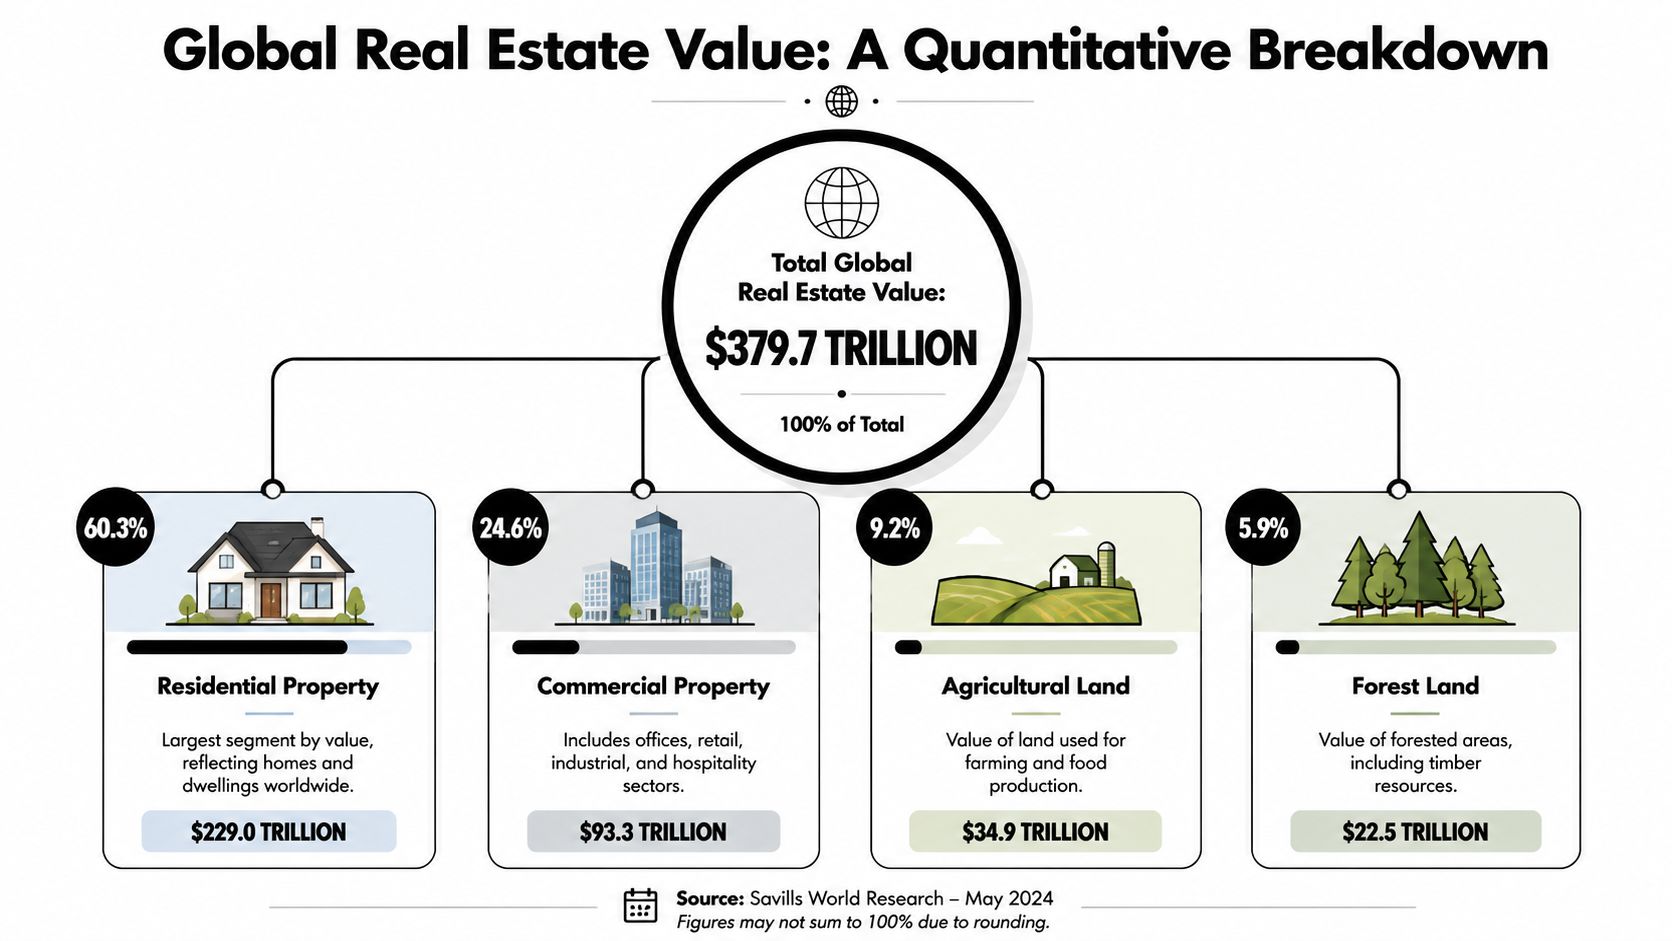
Global real estate market value sits at about $393.3 trillion at end-2024 (Savills global market analysis). That headline matters less as trivia than as a map of where wealth, liquidity, and investor competition are concentrated.
For a private investor, the number only becomes useful when you translate it into allocation decisions. A market can be enormous and still offer weak net returns in parts of it. Another can be smaller, less liquid, and yet provide better income or stronger medium-term growth. The useful question isn't “how big is global property?” It's “what does that size tell me about risk, pricing power, yield, and exit options?”
That is where the global real estate market value becomes practical. It helps you separate deep, institutional markets from thinner ones, identify where residential dominates versus where commercial is driving returns, and judge whether a market's headline value is supported by cash flow or by scarcity and capital concentration.
Understanding the Scale of Global Property
At roughly $393.3 trillion at end-2024, global real estate is larger than any other major asset base discussed by private investors. As noted earlier, that scale matters because market size influences liquidity, pricing discipline, financing access, and your likely exit options.

For portfolio construction, the headline number is most useful as a filter. It helps investors separate markets where capital is already dense and transaction evidence is easier to verify from markets where prices can look attractive but underwriting has to carry more of the risk assessment.
Large property markets usually support deeper debt markets, broader buyer demand, and more consistent valuation evidence. Those features tend to reduce execution risk rather than eliminate it. Smaller or less mature markets can still outperform, but returns there are often more sensitive to currency moves, legal process, sponsor quality, and local political shifts.
That creates a practical allocation question. What role is each market supposed to play?
- Established markets often suit the core part of a portfolio where liquidity, legal clarity, and capital preservation matter most.
- Mid-sized markets can offer a better balance between transparency and income, especially where occupational demand is sound but global capital is not yet fully compressed into pricing.
- Emerging markets can justify a smaller, higher-conviction allocation where growth prospects are stronger, but only if the investor can handle wider pricing dispersion and more complex exits.
Market value also gives a clue to who you are competing against. In the largest markets, private investors are often bidding alongside institutions, sovereign capital, and specialist operators. That usually means less mispricing, sharper asset management standards, and lower tolerance for weak fundamentals. In thinner markets, mispricing can be wider in both directions. That can create opportunity, but it also raises the cost of getting the analysis wrong.
For investors screening countries one by one, broad market size becomes more useful when paired with yield, tax treatment, supply constraints, and transaction activity. A good starting point is to compare countries through detailed international property investment guides, then test asset-level assumptions with a valuation guide with Excel tips.
How the Global Market is Valued
The headline figure for global property isn't produced by one single ledger. It's assembled from national housing statistics, land values, commercial market evidence, and private-sector valuation models. That's why serious investors should always ask not only “what's the number?” but “how was it built?”
Residential values
Residential property is usually the easiest part of the market to estimate because most countries publish some version of house price data, transaction evidence, or stock estimates. In the UK, for example, the Office for National Statistics tracks house price data through the UK House Price Index, which gives analysts a benchmark for average pricing and market direction.
From there, firms aggregate the value of the housing stock by combining price data with estimates of the number and type of homes. It isn't perfect, but it's a strong starting point in transparent markets.
Commercial and income-producing assets
Commercial real estate is valued differently because the asset is usually worth what its income stream can support. Analysts look at rent, occupancy, lease terms, operating costs, and the yield buyers are prepared to accept. MSCI, CBRE, JLL, Knight Frank, and Savills all track different parts of this process through transaction databases and market reports.
That's why commercial values can move sharply even when rents are stable. If financing costs change or investor risk appetite shifts, yields adjust, and capital values reprice.
A simple discounted cash flow model helps investors understand this. If you want a straightforward walkthrough, this valuation guide with Excel tips is useful because it breaks down how future income gets translated into present value.
Why methodology matters to investors
Two markets can look equally attractive on the surface and still deserve different treatment. One may have abundant transaction evidence and transparent pricing. The other may rely on thin comparables and more subjective assumptions.
Use market value data as a screening tool, not as a substitute for underwriting. Before you buy, you still need to test income quality, financing sensitivity, tax leakage, and exit demand. Investors who want a sharper grasp of the income side should understand the mechanics of calculating property return on investment, because valuation and return are linked but not identical.
Global Real Estate Value by the Numbers
About $393.3 trillion. That was the estimated value of global real estate at the end of 2024, as noted earlier in the Savills analysis. For a private investor, the more useful question is not how large that number is, but how it is distributed across countries and sectors, because that shapes liquidity, pricing power, and the range of strategies that can work in each market.
Within that global pool, the UK sits in the top tier by size. Its share is roughly 4 to 5% of total global real estate value in the cited comparison framework, which puts it in the same conversation as the world's deepest and most institutionally followed property markets.
What the composition tells you
Scale matters, but composition matters more.
In the UK, residential property accounts for more than three quarters of total real estate value in the same global comparison work. That has a direct portfolio implication. A market dominated by owner-occupied and rented housing usually moves on credit conditions, household income, planning constraints, and demographics. Commercial real estate responds faster to leasing demand, refinancing costs, and changes in investor pricing.
That difference helps explain why the same country can suit very different objectives.
| Segment | What drives value most | Investor implication |
|---|---|---|
| Residential | Affordability, supply constraints, household demand | Better suited to capital preservation, broad occupier demand, and lower vacancy volatility |
| Commercial | Tenant quality, lease length, yield shifts | Better suited to income targeting, active management, and tactical repricing opportunities |
A large residential base also tends to make national property values look more stable than the investable opportunity set really is. Housing is less frequently traded, less uniformly priced, and influenced by policy decisions that do not affect offices, warehouses, or retail in the same way. Investors who only look at the headline market value can miss where returns are actually being generated.
The UK as a global benchmark
The UK is a useful benchmark because it combines market depth with persistent supply friction. As noted earlier, official and industry data point to a housing market where new supply has lagged demand, while residential values have continued to edge higher. That usually supports capital preservation, but it can also compress forward returns if entry pricing gets ahead of local incomes.
The opportunity set inside one mature market is far from uniform. Earlier cited data also highlighted gross buy-to-let yields in parts of the South East and stronger rental growth in prime logistics assets near key ports, alongside very low vacancy. Those are distinct exposures. One is driven mainly by household affordability and rental demand. The other depends on occupier expansion, trade flows, and the scarcity of modern warehouse stock.
That is the practical use of market-size data. It helps you separate markets that are large because they contain vast amounts of low-turnover residential stock from markets, or sub-sectors, where pricing is being set by active income-producing assets.
Practical rule: Market size shows where capital is concentrated. Market composition shows where your strategy is most likely to work.
A sensible first screen is to pair market-value data with income data. Comparing rental yields by country helps investors distinguish between markets that offer scale and markets that offer cash flow, before they test tax, financing, and asset-level risks.
Analysing Established and Emerging Markets
Roughly speaking, a private investor choosing between established and emerging property markets is deciding how much uncertainty they want to price into returns. Market size matters here, but composition matters more. A large market with deep liquidity, reliable title, and active lending can support very different portfolio outcomes from a smaller market where headline yields are higher but exit routes are narrower.

What an established market offers
The UK remains a useful reference point because it combines scale with relatively clear market infrastructure. In 2025, the UK residential property market was valued at about £9.0 trillion, up 4.2% year on year, with average house prices at £288,000 versus £277,000 in 2024, according to the verified ONS-linked data set. National rental yields averaged 5.8%, and northern cities such as Liverpool and Newcastle reached 7.2% in the same dataset (UK property investor guide).
For investors, the point is not that the UK is large. It is that a market of that size contains multiple return profiles under one legal and financial system. A high-value mature market can still offer income-led opportunities where local rents, affordability, and supply are more supportive than national averages suggest.
Established markets also tend to improve portfolio control in ways that headline valuation tables miss. Legal enforcement is usually clearer. Financing is more available across borrower types. Exit liquidity is broader, which matters most when an investor needs to sell into a weaker cycle rather than a strong one.
Where the trade-offs sit
Scale and transparency come with a cost. The same UK dataset notes that foreign buyers accounted for 8% of purchases, there are no restrictions on overseas ownership, and a 5% surcharge applies to stamp duty land tax on second homes in the cited 2025 framework. Those frictions reduce net yield and can change the break-even hold period, especially for investors using moderate debt.
Emerging markets often offer the reverse profile. Entry prices may be lower, rental income can screen well against purchase cost, and repricing can be faster if a city is moving through an early growth phase. But higher returns are often compensation for weaker market plumbing, including less reliable title records, shallower mortgage markets, lower transparency, and greater currency risk.
That distinction has a direct portfolio implication. Established markets are usually better suited to capital preservation, lower operational friction, and larger ticket sizes. Emerging markets can improve portfolio growth and income, but position sizing matters more because mistakes are harder to reverse.
Investors comparing higher-growth jurisdictions should treat country selection as a filtering exercise before looking at individual assets. A useful starting point is this review of the top emerging property investment markets.
The commercial comparison
The same pattern appears in commercial real estate. In the UK's commercial sector, the verified data puts total market value at £1.1 trillion in 2025, with investment volumes up 18% year on year to £45 billion. Logistics and industrial captured 32% of transactions at an average yield of 4.9%, while offices stood at 6.2%. Logistics occupancy was cited at 95%, and Knight Frank projected 4 to 6% total returns through 2030 in the verified dataset.
For a private investor, that breadth matters because mature commercial markets allow more precise risk selection. An investor can choose lower-yielding logistics for income durability, higher-yielding offices for recovery potential, or avoid a segment altogether if leasing risk looks mispriced. In many emerging markets, that level of sector choice is narrower, so country risk and asset risk are more tightly linked.
A large market is not automatically the better market. It is often the better-understood market. That difference shapes underwriting standards, financing terms, and exit probabilities, which is why global market value should be used as a starting screen, not an investment conclusion.
Key Drivers and Risks Shaping Market Value
Property values don't move in isolation. They respond to money, people, policy, and the cost of complying with new rules. Investors who understand those mechanics make better decisions than those who only track asking prices.
Drivers that support value
Cross-border capital remains one of the clearest drivers in income-producing property. In Q1 2026, UK commercial real estate transactions reached £15 billion to £20 billion, supported by a 37% year-on-year surge in global cross-border investment in the verified JLL-linked data. The same dataset ties that flow to moderated interest rates, including a Bank of England base rate of 4.25% in May 2026, and notes projected 4% annual rent growth through 2030 in UK logistics and multifamily assets (JLL global market perspectives).
That's a useful example of cause and effect. When debt costs ease and investors can compare property income favourably against bond yields, liquidity returns. Once liquidity returns, price discovery improves and transaction activity follows.
The UK data also points to very specific micro-drivers:
- Prime South East logistics voids at 2.5% in the verified framework.
- Value-add strategies targeting EPC A retrofits with cited IRRs of 8 to 10%.
- Manchester and Birmingham big box warehouses offering 5.2 to 5.8% yields.
These aren't just statistics. They show that capital increasingly rewards assets that combine income visibility with modern specification.
Risks that can erode returns
The same datasets make the downside clear. Regulation can directly reduce investor profitability. Compliance costs can shift the economics of refurbishment. Tax changes can alter buyer demand at the margin. A market may remain valuable in aggregate while becoming less attractive for a specific strategy.
That distinction matters most in residential buy-to-let, where net return can deteriorate even if prices remain firm.
A wider view of international property trends is useful here because many of these risks aren't local accidents. They tend to show up across multiple markets in different forms, especially around energy efficiency, tenant protection, and foreign buyer taxation.
The strongest markets still reprice. The key question is whether the repricing is cyclical, or whether regulation has changed the economics of ownership.
Using Market Data in Your Investment Strategy
$393 trillion is too large a figure to guide an investment decision on its own. Its real use is narrower and more practical. It helps private investors judge where liquidity is deepest, which segments justify a strategic allocation, and where headline scale masks weak after-cost returns.

A sensible starting point is portfolio function.
Investors often begin with a preferred country or city, then look for assets that fit that preference. The stronger method is to decide what the capital needs to do first. Market size matters, but only in context. A large, transparent market may suit capital preservation and exit flexibility, while a smaller or less followed market may be more useful for yield or growth if the risk premium is wide enough.
| Portfolio role | What to look for | Typical fit |
|---|---|---|
| Core stability | Transparent regulation, broad occupier demand, liquid exits | Established residential markets |
| Income focus | Durable rental demand, acceptable tax drag, resilient cash flow | Select regional cities and logistics |
| Growth sleeve | Pricing inefficiency, infrastructure improvement, policy reform | Emerging or repositioning markets |
This framework prevents false comparisons. A prime London apartment, a regional buy-to-let property, and a warehouse near a major freight corridor may sit in the same national market, but they serve different portfolio jobs and should be underwritten differently.
The next filter is the gap between aggregate market value and investor return. Large markets attract attention because they are familiar, liquid, and institutionally backed. None of that guarantees an attractive net yield. In mature residential markets especially, taxes, financing costs, energy-efficiency capex, and tighter regulation can reduce returns even while capital values remain high.
That is why market value should be used as a top-down screen, not a buy signal.
A better shortlist usually comes from three questions:
- Does the market have enough depth to support refinancing and exit? Size often improves liquidity, but liquidity can still vary sharply by city and asset type.
- Is capital concentrated in overpriced segments? In mature countries, secondary cities or operational sectors can offer better entry pricing than trophy locations.
- Do net returns still work after tax, regulation, and capex? Gross yield is only the starting figure.
The macro number becomes useful at the micro level in this context. If a country accounts for a large share of global real estate value, that usually points to legal maturity, financing depth, and a wider buyer pool. Those are real advantages. But if ownership costs absorb too much income, investors may be better paid in less fashionable cities, different sectors, or markets earlier in their repricing cycle.
Private investors who use market value data well usually reach a more selective conclusion. The objective is not to own property in the biggest markets. It is to place capital where market depth, income resilience, and policy conditions support the role that asset is meant to play in the portfolio.
A Strategic Outlook for Global Investors
The global real estate market value is useful because it tells you where wealth is concentrated. It becomes powerful when you use it to judge liquidity, segment exposure, policy risk, and the gap between headline prices and real returns.
The strongest portfolios usually combine different market types. Established markets can anchor a portfolio with depth and legal certainty. Select higher-growth markets can add upside, provided the investor is being paid for the extra risk. Within each market, the best opportunities usually sit below the headline number, at city, district, and asset level.
Investors who treat market value data as a strategic tool, rather than a talking point, make clearer decisions about allocation, underwriting, and timing. That discipline matters in every cycle.
If you're comparing countries, yields, taxes, and entry routes for cross-border buying, World Property Investor offers practical market guides and research to help you shortlist locations and analyse deals with more confidence.