For any serious property investor, a handful of key performance indicators truly matter. When investing in holiday lets, holiday let occupancy rates sit at the top of that list. In simple terms, this is the percentage of nights your property is booked and paid for by guests. A high rate signifies strong demand and consistent cash flow. A low one represents lost income you can never recover.
Why Occupancy Rate Is a Critical Metric

If you are investing in short-term rental property, understanding occupancy is non-negotiable. Think of your property like a commercial flight; every empty night is an unsold seat—a permanent loss of potential revenue. A common mistake for new investors is to focus solely on achieving the highest possible nightly price. This can be a deeply flawed strategy.
Chasing high nightly rates often leads to fewer bookings and prolonged, costly vacant periods, especially during the off-season. This creates unpredictable and unstable cash flow, the antithesis of what a sound property investment should deliver. The objective is to find the optimal balance between your occupancy rate and your Average Daily Rate (ADR).
The Engine of Your Profitability
Consistent bookings, even at a more moderate price, generate the stable and predictable revenue required for long-term success. This consistency is the bedrock of your profitability, allowing you to comfortably cover fixed costs—such as your mortgage, insurance, and utilities—while generating a reliable return on investment (ROI). To understand this fundamental concept in more detail, it's worth reviewing What Is Occupancy Rate and How to Master It for Your STR.
An empty property costs you money every single day. A booked property, even at a slightly lower rate, generates revenue. The key is to maximise total income over the year, not just on peak weekends.
To see how these core metrics interact, it is helpful to break them down.
Key Metrics for Analysing Holiday Let Performance
This table breaks down the fundamental metrics every investor needs to understand, defining each term and its importance in evaluating a property's financial health.
| Metric | Definition | Why It Matters for Investors |
|---|---|---|
| Occupancy Rate | The percentage of available nights your property is booked by guests. | This is your primary indicator of demand. It drives gross revenue and shows how well your property is performing within its market. |
| Average Daily Rate (ADR) | The average rental income earned per occupied room on any given day. | This demonstrates your pricing power. The goal is to set an ADR that maximises bookings without leaving money on the table. |
| Revenue Per Available Room (RevPAR) | Your ADR multiplied by your occupancy rate. It measures revenue across all available rooms, not just those sold. | RevPAR provides a holistic view of performance. It combines occupancy and pricing into a single, powerful metric for tracking profitability. |
| Rental Yield | The annual income from your property as a percentage of its total value or cost. | This is your ultimate measure of ROI. It tells you how effectively your capital is working for you after all costs are considered. |
Understanding these metrics allows you to move beyond simple occupancy figures and make strategic decisions about pricing, marketing, and long-term financial planning.
Occupancy vs. Yield
It is crucial not to confuse high occupancy with high profit. While the two are linked, they are not synonymous. The true profitability of your investment is measured by its rental yield, which accounts for both your income and your total capital outlay.
A successful holiday let strategy involves optimising occupancy to drive total revenue, which in turn boosts your overall yield. This guide will help you view occupancy rates not just as a percentage, but as the engine that powers your property's entire financial performance. Mastering this principle is essential for making smarter investment decisions.
How to Calculate and Forecast Occupancy Rates
Before you can forecast future performance, you must understand your historical data. Calculating your holiday let’s historical occupancy rate is a straightforward but essential first step.
(Nights Booked ÷ Total Available Nights) × 100 = Occupancy Rate %
This is a simple but powerful calculation. If your property was available for all 30 days in June and you secured 21 bookings, your occupancy rate would be 70% (21 ÷ 30 × 100). This figure provides a clear baseline, but its real value comes when used to look forward, not just back.
Building a Reliable Revenue Forecast
Historical data is useful, but successful investors focus on future performance. This requires moving beyond your own property’s data to build a forecast using real market intelligence, turning raw data into a strategic plan.
Start by analysing the wider market’s historical performance. Does the area thrive during summer holidays, or does it have a more consistent, year-round appeal? Understanding these seasonal peaks and troughs, based on data from sources like national tourism bodies or local authorities, is fundamental.
Next, layer on the local events calendar. A major music festival, a large conference, or a significant sporting event can create substantial spikes in demand, allowing you to adjust pricing and anticipate near-full occupancy. Equally, knowing when quiet months will occur helps you manage cash flow expectations and plan marketing initiatives in advance.
A simple spreadsheet is all you need to start modelling this. Set up columns for each month and project your revenue based on three realistic scenarios:
- High Season: Project higher occupancy (e.g., 80-90%) and a premium ADR.
- Shoulder Season: Model for moderate occupancy (e.g., 60-70%) with a standard ADR.
- Low Season: Forecast lower occupancy (e.g., 30-40%) and plan for tactical discounts to stimulate bookings.
Introducing a Superior Metric: RevPAN
While occupancy is a core metric, it only tells part of the story. A high occupancy rate looks good on paper, but if you achieved it by aggressively cutting your prices, you might be less profitable than a competitor with fewer bookings at a higher rate.
This is why seasoned investors often focus on Revenue Per Available Night (RevPAN). This metric provides a clearer picture by blending both occupancy and pricing into a single, more meaningful figure.
RevPAN = Occupancy Rate × Average Daily Rate (ADR)
Let’s compare two properties. Property A boasts a 90% occupancy but has a low ADR of £80. Its RevPAN is £72. Meanwhile, Property B has a lower 70% occupancy but achieves a healthier ADR of £120, giving it a RevPAN of £84.
Property B is the clear winner. It generates more revenue from every night the property is available, whether booked or not. This is the kind of metric that helps you calculate the return on an investment property with genuine accuracy. By focusing on RevPAN, you can make smarter pricing decisions that maximise total income, not just chase bookings for the sake of it.
UK Holiday Let Occupancy: A Deep Dive into Regional Trends
National averages for holiday let occupancy rates provide a useful starting point, but they mask significant regional variations. The UK market is a patchwork of distinct local economies, and uncovering the real investment opportunities requires a deeper analysis.
Digging into regional data reveals how post-pandemic travel habits, shifting demand drivers, and local supply are creating wildly different investment landscapes. For a discerning investor, understanding these nuances separates a high-performing asset from a struggling one.
Historically, traditional tourist destinations such as Cornwall, Devon, and the Lake District were the undisputed champions of occupancy. Their appeal was seasonal but powerful, enabling them to command premium rates during summer holidays. However, the market has evolved. An oversupply of listings in many of these established hotspots is now putting significant pressure on returns.
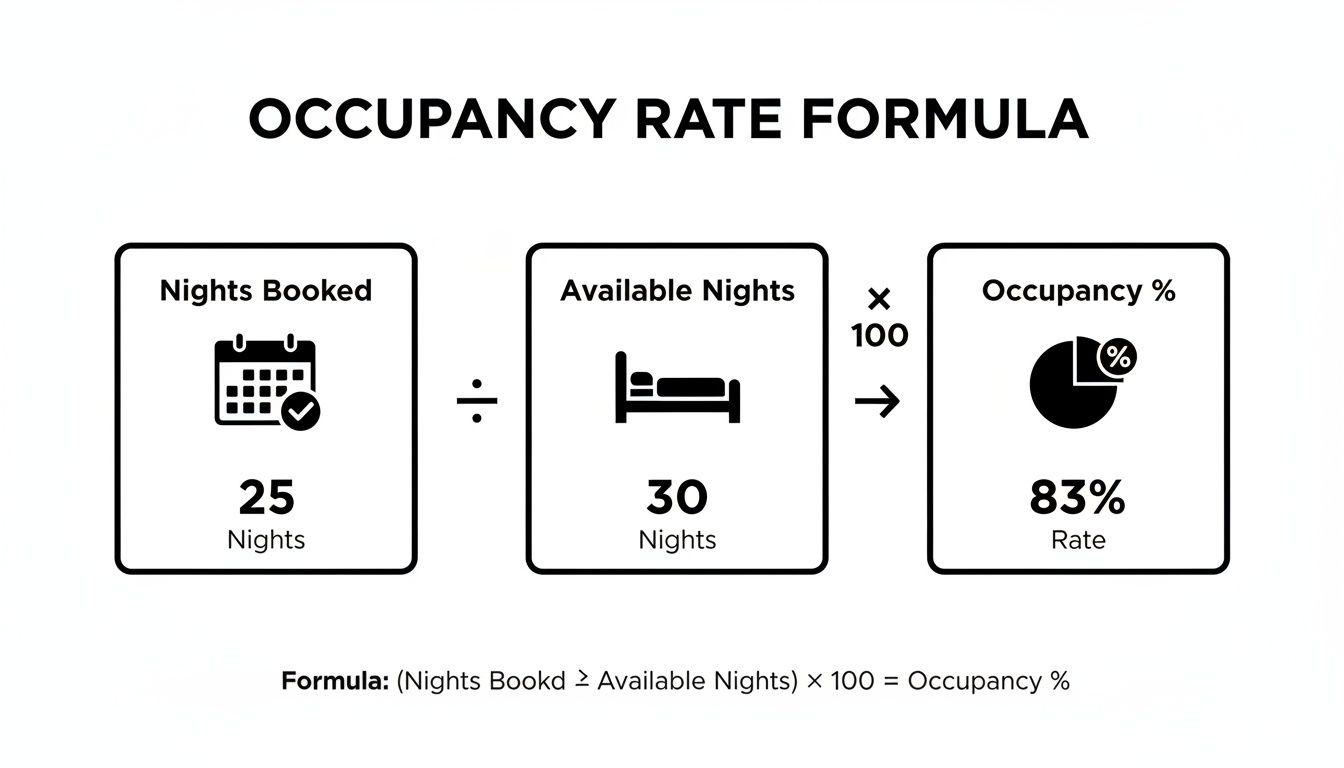
As this image shows, occupancy is simply the percentage of available nights that were actually booked. It's the core metric for measuring how well your holiday let is performing.
Emerging Powerhouses: Why Urban Lets Are Gaining Ground
While some rural retreats grapple with increased seasonality, a new breed of holiday let is performing strongly in the UK’s major cities. Urban hubs like Manchester, Liverpool, and Glasgow are now delivering remarkably high and consistent occupancy rates all year round.
This is driven by a diverse mix of demand. These cities attract a steady flow of visitors for business, conferences, sporting events, concerts, and weekend city breaks. This creates a reliable stream of bookings that smooths out the dramatic peaks and troughs seen in seasonal markets.
This stability is a game-changer for investors who prioritise predictable cash flow and strong ROI. A picturesque cottage in the Cotswolds might achieve a higher ADR for a few weeks in August, but a well-located city apartment often delivers a far stronger and more dependable annual yield because it is rarely empty. Our detailed guide on property investment in 2025 explores these shifting market dynamics in greater detail.
Supply, Demand, and the Risk of Saturation
The UK short-term rental market is balancing supply and demand. Recent data paints a clear picture: in August 2025, national occupancy rates slipped to 54%, a 2 percentage point drop year-on-year. This was largely because an influx of new listings outpaced guest demand.
The total number of available short-term rentals climbed to 491,582, a 4% year-over-year increase. Some regions, like the North East, saw supply swell by as much as 9%. This influx of properties led to a 5% national decrease in reserved nights, according to data from VisitBritain, showing how quickly market saturation can erode profitability. You can explore more data on these trends in this VisitBritain market analysis.
For investors, the takeaway from this data is clear: market selection is more critical than ever. Chasing returns in an over-saturated area, no matter how popular it appears, is a high-risk strategy. The smarter play is to identify locations with resilient, year-round demand that can absorb new supply without sending occupancy rates plummeting.
A Tale of Two Markets: Saturated vs. Stable
Let’s use a comparison to illustrate this point:
Established (but Saturated) Market: Cornwall
- Fundamentals: Incredible brand recognition and huge summer demand.
- Risks: Fierce competition, extreme seasonality, and occupancy rates that can fall dramatically outside school holidays. An oversupply of similar properties makes it incredibly difficult to stand out and maintain pricing power.
Emerging Urban Market: Manchester
- Fundamentals: Exceptionally high and stable year-round occupancy, often exceeding 80%. A highly diverse mix of demand from tourism, business, and major events creates a resilient income stream.
- Risks: Average nightly rates are lower than in premium London or Cotswolds properties, but this is typically offset by near-constant bookings, leading to a strong and predictable annual yield.
This contrast shows that the highest holiday let occupancy rates are no longer guaranteed in traditional holiday destinations. Today, they are often found in strategically chosen urban centres. By focusing on markets with solid economic fundamentals and varied demand drivers, investors can build a far more resilient and profitable portfolio.
A Case Study on Manchester's High Occupancy Success
While traditional holiday locations often battle with seasonal lulls and market saturation, experienced investors are increasingly looking towards urban centres that deliver consistent, year-round returns. Manchester exemplifies this trend, offering a masterclass in how to achieve and sustain high holiday let occupancy rates through a diversified demand strategy.
Manchester's success is not accidental; it is a direct result of its dynamic economic and cultural fundamentals. The city’s appeal is incredibly broad, attracting visitors for a wide range of purposes. This blend of demand drivers provides a powerful blueprint for investors seeking to minimise vacant nights and maximise cash flow.
Unlike a seaside town reliant on summer tourism, Manchester’s booking calendar is supported by a solid, year-round schedule of events and commercial activity. This constant flow of demand is the engine behind its impressive performance, proving that stability can be far more profitable than sporadic, high-priced bookings in more volatile seasonal locations.
The Power of Diversified Demand
To grasp why Manchester works so well for investors, it is essential to analyse the different visitor profiles it attracts. This is not a market dependent on a single guest type.
- Business and Corporate Travel: As a major economic hub for the North of England, the city hosts a steady stream of corporate travellers for meetings, conferences, and projects throughout the week. This fills the mid-week occupancy gaps that are often vacant periods in leisure-only markets.
- Major Sporting Events: Home to two of the world’s biggest football clubs, Manchester United and Manchester City, the city sees a huge influx of domestic and international fans for matches. This creates predictable demand spikes from August through to May.
- Cultural and Entertainment Scene: From sold-out concerts at the AO Arena to its vibrant arts scene in the Northern Quarter, Manchester has a constant stream of events that attract both weekend and mid-week visitors.
This reliable flow of guests means properties do not sit empty waiting for the next school holiday.
Analysing the Manchester Model's Financials
The data speaks for itself. Recent analysis from Beyond, a leading revenue management platform, shows how Manchester’s strategy translates directly into stronger financial results for property investors.
The table below offers a snapshot of how Manchester compares to other key UK holiday let markets, based on 2025 data. It clearly illustrates the trade-off between securing a high nightly rate and achieving consistently high occupancy.
UK Holiday Let Market Performance Snapshot (2025 Data)
| Market | Occupancy Rate | Average Daily Rate (ADR) | Revenue Per Available Night (RevPAN) |
|---|---|---|---|
| Manchester | 83% | £100 | £85 |
| London | 65% | £231 | £150 |
| Cotswolds | 56% | £196 | £110 |
As you can see, Manchester emerged as the UK's top performer for occupancy, hitting an impressive 83%. While its Average Daily Rate (ADR) of £100 seems modest next to London's £231 or the Cotswolds' £196, its high occupancy delivered a rock-solid Revenue Per Available Night (RevPAN) of £85. This demonstrates a market that works hard for investors all year round.
The key takeaway is clear: Manchester’s exceptionally high occupancy more than compensates for its lower nightly rate, delivering strong and incredibly stable returns. For long-term investors, consistent bookings are almost always a more reliable path to profit than chasing premium prices in less predictable markets.
The city’s relative affordability is another significant advantage, making it a popular destination for budget-conscious travellers seeking city breaks. You can get a better feel for local costs by reading our guide to Manchester's living expenses for residents and investors. For global investors, the Manchester model offers a powerful lesson in identifying markets with strong, underlying fundamentals that can deliver consistent, high occupancy and stable returns.
Actionable Strategies to Increase Your Occupancy Rate

Understanding your data is one thing; turning that knowledge into a fuller booking calendar is where the real work—and profit—begins. Boosting your holiday let occupancy rates is not about luck; it is about making your property more visible, desirable, and easier to book than your competitors.
Here, we move beyond theory into the proven, practical tactics that have a direct impact on your booking calendar and bottom line. Consider this a toolkit for taking active control of your investment's performance.
Master Dynamic Pricing
A 'set and forget' pricing strategy is one of the fastest ways to leave money on the table. Dynamic pricing simply means adjusting your nightly rates based on real-time supply and demand. This allows you to increase prices during high-demand periods—such as bank holidays or local festivals—and strategically lower them to attract guests during quieter spells.
Using a smart pricing tool or simply monitoring market data allows you to react instantly. If a major concert is announced in your city, your rates should reflect that surge in demand. Likewise, if mid-week bookings are slow, a small, targeted discount can be all it takes to secure a reservation you would otherwise miss, turning a zero-revenue night into a profitable one.
Optimise Your Digital Shopfront
Your online listing is your property’s digital shopfront. In a crowded marketplace, a weak first impression means potential guests will simply scroll past. This is why professional photography is not an expense; it is one of the highest-return investments you can make.
High-quality images that showcase your property’s best features—its light, space, and unique character—are essential for capturing attention. Pair these with a compelling, benefit-led description. Instead of just listing amenities, sell the experience.
Good: "Two-bedroom flat with a balcony."
Better: "Enjoy your morning coffee on a sun-drenched balcony overlooking the city, the perfect start to a day of exploring."
For hosts on specific platforms, there are expert guides on how to increase Airbnb bookings that offer tailored advice for getting the most out of your listing.
Diversify Your Guest Profile
Relying on a single type of guest, such as summer holidaymakers, makes your business vulnerable to seasonal lulls. To build a more resilient income stream and fill your calendar during the low season, you must proactively target different types of visitors.
Consider who else might need accommodation in your area during off-peak months. Could you attract digital nomads by highlighting a dedicated workspace and high-speed Wi-Fi for longer stays? Or perhaps appeal to business travellers by mentioning your proximity to a conference centre? Many successful investors who learn how to start an Airbnb business do so by identifying and catering to these underserved niches.
Other effective strategies include:
- Encouraging Direct Bookings: Build a simple website to capture direct reservations, which helps you reduce your reliance on booking platforms and save on commission fees.
- Managing Guest Reviews: Actively request and respond to every review. Positive social proof is incredibly powerful and directly influences whether new guests book with you.
- Offering Flexible Policies: In an uncertain world, flexible cancellation options can significantly lower the barrier to booking and give guests the confidence to commit.
By implementing these tactics, you can transition from being a passive property owner to an active asset manager—taking full control of your performance and pushing your holiday let occupancy rates to new heights.
Your Next Steps in Holiday Let Investment
Understanding holiday let occupancy rates is not just an academic exercise. It is the single most important skill for building a resilient and profitable short-term rental business. This guide was designed to shift your approach from guesswork towards data-led investment.
Success in this market comes down to executing the fundamentals: researching locations properly, understanding true demand drivers, and using forecasting to optimise your property's performance. It is about seeing the clear relationship between occupancy, nightly rate, and your final ROI.
Key Lessons for the Modern Investor
If there is one lesson to take from our Manchester case study, it is this: consistent, year-round demand will almost always outperform chasing high seasonal prices in a volatile market. An occupied property generating a steady income is far more valuable than an empty one waiting for a peak-season payday that may not arrive.
This principle holds true whether you are investing in the UK or considering opportunities overseas. The 'Manchester Model'—built on a strong mix of demand from business, tourism, and local events—provides a robust template for identifying other high-potential urban markets.
Your primary goal should be to build a portfolio that delivers predictable cash flow. Focus on markets with solid economic fundamentals that can sustain high occupancy, even as new supply comes online or travel trends evolve.
By applying these lessons, you can move forward with greater confidence and a sharper eye for a good investment. You are now better equipped to:
- Analyse deals with greater clarity, looking past the optimistic sales pitch to see the realistic revenue potential.
- Forecast your potential income by modelling for high, shoulder, and low seasons using real market data.
- Manage your properties with more precision, using dynamic pricing and smart marketing to keep your calendar full year-round.
Ultimately, understanding the dynamics of holiday let occupancy transforms you from a passive property owner into a strategic investor. You now have the knowledge to make better decisions, manage risk, and build a holiday let business that stands the test of time.
Frequently Asked Questions About Occupancy Rates
Here we address some of the most common questions from investors. These are the practical, real-world queries that move you from simply understanding the concept of occupancy to using it to make smarter decisions in the holiday let market.
What Is a Good Holiday Let Occupancy Rate?
There is no single "good" number. For a well-managed holiday let in a strong market, a rate between 60% and 75% is a solid annual benchmark. However, this figure is entirely dependent on your specific market. A city-centre apartment in Manchester might target 80%+ year-round, while a seasonal cottage in Cornwall might hit that in summer but drop to 30% in winter.
The key takeaway is that occupancy should never be viewed in isolation. A property running at 90% occupancy sounds impressive, but if this is only achieved through aggressive price-cutting, it could easily be less profitable than a competitor at a 65% rate with a premium nightly price. Your goal is not just to fill empty nights; it is to optimise total revenue and ROI.
How Does Seasonality Impact Occupancy?
Seasonality is one of the most powerful forces affecting holiday lets. Traditional tourist destinations often experience dramatic peaks and troughs. A property in the Lake District, for instance, might be fully booked during summer weekends and school holidays, only to struggle for mid-week bookings between November and February.
Smart investors do not just accept this; they plan for it. To counter the seasonal dip, they:
- Use dynamic pricing to make rates more attractive during quiet months.
- Shift marketing to highlight "cosy" or "secluded" features to appeal to winter travellers.
- Target different guest profiles, such as couples or hikers, who often travel outside main holiday seasons.
By contrast, urban locations tend to have less severe seasonality. Their demand is often fuelled by a more diverse mix of business travel, city breaks, and year-round events, leading to a more stable occupancy pattern.
Should I Prioritise a High Occupancy Rate or a High Nightly Rate?
This is the classic dilemma for STR investors. The correct approach is to strike a balance that maximises your total annual income. If you focus only on a high nightly rate, you risk long, expensive vacant periods. Conversely, if you chase a high occupancy rate by constantly offering discounts, you will erode your profit margins.
The best strategy is to focus on your RevPAN (Revenue Per Available Night), calculated by multiplying your Occupancy Rate by your Average Daily Rate. This single metric cuts through the noise and tells you exactly how much revenue you are generating for every night your property is available, providing a far more accurate picture of its financial performance.
For example, a property with 65% occupancy at a £150 nightly rate (£97.50 RevPAN) is more profitable than one with 80% occupancy at a £120 nightly rate (£96 RevPAN). By analysing your RevPAN, you can make pricing decisions based on data, not guesswork, and find that profitable sweet spot.
At World Property Investor, we provide the data-driven guides and market analysis you need to make smarter investment decisions. Explore our resources to identify high-yield property markets across the globe at https://www.worldpropertyinvestor.com.