A rental yield calculator is one of the most practical tools in an investor's arsenal. It distils the financial details of a property deal into a single percentage, showing the annual income a property generates relative to its total cost. This simple figure allows you to compare vastly different opportunities—whether it's a city-centre flat in Manchester or a holiday villa in the Algarve.

Your Guide to Smarter Property Investment Decisions
When analysing an investment property, the purchase price is only the beginning of the story. The true test of an asset’s performance is its ability to generate income. This is where rental yield becomes a critical metric for any serious global investor.
Think of rental yield as the interest rate on your property investment. It creates a universal language that measures how hard your capital is working, allowing you to make direct, like-for-like comparisons between different markets and property types.
Why Yield Is a Universal Metric
Without a standard measure, comparing a £250,000 apartment in the UK with a €280,000 villa in Portugal is largely guesswork. A rental yield calculator removes this ambiguity, providing a clear percentage that reveals a property's earning power relative to its cost. This is vital for:
- Objective Analysis: It moves you past emotional bias and focuses purely on financial performance.
- Market Comparison: It allows you to evaluate whether an established market like London offers better returns than an emerging one like Istanbul.
- Portfolio Strategy: It helps you build a balanced portfolio by sourcing properties that meet specific cash flow or growth objectives.
By focusing on yield, you shift from simply buying property to making calculated investment decisions. It is the foundational step in moving from being a landlord to becoming a strategic property investor.
Ultimately, understanding how to use a rental yield calculator empowers you to base your decisions on solid data, not market hype. As you make smarter property investment decisions, staying informed is key; comprehensive Investorpulse Reports offer valuable market insights to support this. This approach ensures every addition to your portfolio is properly scrutinised for its true profit potential.
This guide will demystify the formulas and figures, providing the confidence to analyse any property deal. You can also explore the fundamentals in our article on https://www.worldpropertyinvestor.com/how-to-make-money-in-property/.
What Is Rental Yield and Why It Matters
At its core, rental yield is a simple metric that answers a crucial question: how hard is your money working for you? It is a straightforward percentage that measures the annual return from your property's rental income against its total cost.
This single figure allows you to cut through the noise and compare vastly different opportunities on a level playing field. Whether you’re weighing up a city-centre flat in Manchester or a holiday villa in Dubai, yield provides a common language to measure performance. It is the key to making decisions based on data, not guesswork.
Gross Yield vs Net Yield
It is vital to understand the two main types of rental yield. They tell very different stories about a property's real-world profitability.
Gross Yield: This is a quick, 'back-of-the-envelope' calculation. It is found by dividing the annual rental income by the property’s purchase price. While useful for a rapid first look, it ignores all the costs associated with owning and managing a property.
Net Yield: This is the number that truly matters for your bottom line. It is calculated by subtracting all annual running costs—such as maintenance, insurance, letting agent fees, and service charges—from your rent before dividing by the property's total cost.
Understanding the difference between a superficial gross yield and an accurate net yield is the first step towards realistic financial forecasting. An attractive gross yield can easily be eroded by high expenses, making the net figure the only one that truly matters.
The Real-World Impact on Your Returns
The distinction between gross and net yield is not merely academic; it directly affects your monthly cash flow.
Take official UK government data, for instance. While gross figures for average property income declared by landlords may sound promising, seasoned investors using a rental yield calculator know that once all operational costs are deducted, the actual net return will be substantially lower. To explore this topic in more detail, you can read our guide on understanding rental yields.
Furthermore, with bodies like the Office for National Statistics (ONS) reporting sharp rental price increases, it is easy to be drawn in by attractive top-line numbers. However, these headlines must always be balanced with a realistic budget for expenses. This is why a precise calculation is so important. By mastering this metric, you gain the clarity needed to spot genuinely profitable investments and sidestep those that only look good on paper. For a deeper dive into these figures, you can explore the latest official property rental income statistics.
The Three Essential Formulas for Calculating Your Return
To gain a true understanding of any rental yield calculator—or to run the numbers yourself—you must understand the mathematics behind it. It all comes down to three core formulas. Each provides a deeper, more revealing insight into a property's financial health.
Learning these will take you from making quick, surface-level comparisons to carrying out a proper, detailed analysis of your potential return on investment.
This simple image breaks down the basic concept: your property is an asset that generates rental income. When you measure that income against what the property cost you, you get your yield.
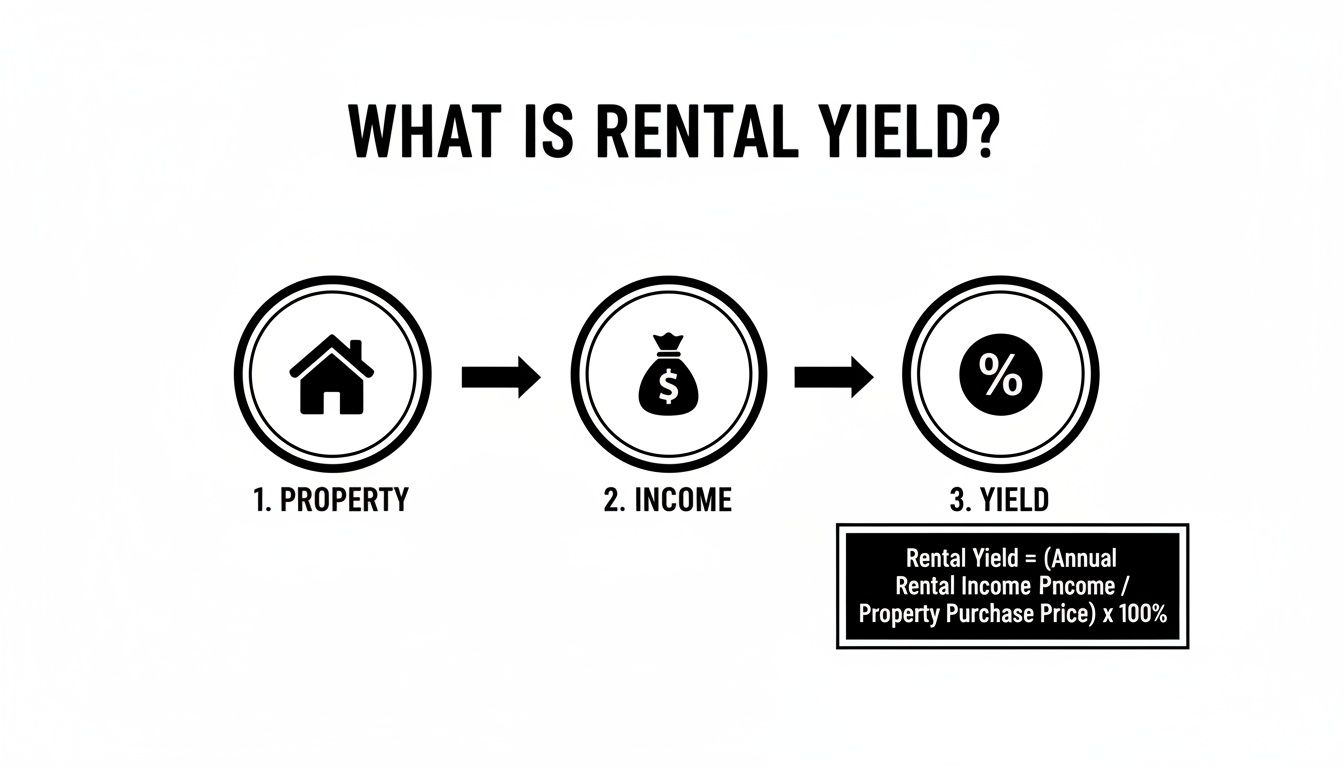
This path from asset to income to performance is the foundation for every calculation we are about to walk through.
1. Gross Rental Yield: The Quick Snapshot
Gross yield is the simplest and fastest metric. It is perfect for conducting an initial sweep of several properties to see which ones warrant a closer look. Think of it as a high-level view of potential returns before you begin to dig into the running costs.
The formula is straightforward:
(Annual Rental Income ÷ Property Purchase Price) x 100 = Gross Yield %
For example, consider a flat in Manchester for £200,000. You expect it to rent for £1,000 a month, giving an annual income of £12,000. The calculation would be: (£12,000 ÷ £200,000) x 100 = 6.0% Gross Yield.
2. Net Rental Yield: The Realistic Profitability
This is where serious analysis begins. Net yield paints a much more honest picture by factoring in all the different costs of owning an investment property. It shows you what you will actually have left after all the bills are paid.
The formula requires more information:
([Annual Rental Income – Annual Operating Costs] ÷ Total Property Cost) x 100 = Net Yield %
Here, "Total Property Cost" includes the purchase price plus one-off buying costs like Stamp Duty, legal fees, and any initial refurbishments. Your "Annual Operating Costs" will be items such as:
- Service Charges: Fees for maintaining communal areas in a block of flats.
- Insurance: Landlord and buildings insurance.
- Maintenance & Repairs: A realistic budget for both planned upkeep and unexpected issues.
- Letting Agent Fees: Usually a percentage of the monthly rent.
- Ground Rent: If the property is leasehold.
Using our Manchester flat example, let's say the total acquisition cost was £210,000 after all fees. Your annual running costs come to £3,000. The net yield calculation is: ([£12,000 – £3,000] ÷ £210,000) x 100 = 4.3% Net Yield. A much lower figure, but far closer to reality.
3. Cash-on-Cash Return: The Investor’s Perspective
The cash-on-cash return is a favourite among investors who use leverage (a mortgage). It measures the return on the actual cash you have personally invested in the deal, not the property's total value. It answers the crucial question: "How hard is my money actually working for me?"
For investors financing a purchase, you can learn more about how to calculate return on investment property in our dedicated guide.
The formula looks like this:
(Annual Pre-Tax Cash Flow ÷ Total Cash Invested) x 100 = Cash-on-Cash Return %
"Annual Pre-Tax Cash Flow" is simply your net operating income minus your annual mortgage payments. "Total Cash Invested" is your deposit plus all your buying fees.
For our Manchester flat, imagine you put down a 25% deposit (£52,500) and paid £10,000 in fees, making your total cash invested £62,500. If your annual mortgage payments are £5,000, your pre-tax cash flow is £9,000 (net income) – £5,000 = £4,000.
Your Cash-on-Cash Return is: (£4,000 ÷ £62,500) x 100 = 6.4%.
Once you’re comfortable with these basics, you'll be ready to calculate real estate ROI for any property you analyse, taking into account the unique dynamics of its local market.
Putting the Rental Yield Calculator to the Test
Theories and formulas are a great starting point, but a rental yield calculator proves its worth when you plug in numbers from the real world. This is where abstract opportunities become concrete, comparable financial data. Let's walk through three distinct properties to see how dramatically returns can differ from one market to another.

For this comparison, we will use realistic estimates for property prices, rental incomes, and local running costs. This allows us to see how a rental yield calculator handles both established and emerging markets side-by-side.
The Investment Scenarios
We will analyse three different properties, each representing a common strategy that global investors pursue:
- Manchester, UK: A modern city-centre flat in a mature, high-demand UK market.
- Algarve, Portugal: A holiday let in a well-established European tourism destination.
- Istanbul, Turkey: A buy-to-let apartment in a dynamic, high-growth emerging market.
By running the numbers for gross yield, net yield, and cash-on-cash return for each, we can directly compare their real-world performance and understand the trade-offs involved.
Scenario 1: Manchester City-Centre Flat
Manchester exemplifies a strong UK rental market, but performance varies by postcode. Analysis from sources like PropertyData.co.uk shows that specific postcodes, not just cities, drive profitability.
Let’s run the numbers for our Manchester flat:
- Total Property Cost: £260,000 (includes stamp duty and fees)
- Annual Rental Income: £15,600 (£1,300/month)
- Annual Operating Costs: £3,500 (covers service charges, insurance, maintenance)
- Total Cash Invested (25% Deposit + Fees): £75,000
- Annual Mortgage Payments: £8,000
The calculator gives a Gross Yield of 6.0%, a more realistic Net Yield of 4.7%, and a final Cash-on-Cash Return of 5.5%. A solid, if not spectacular, return typical of a stable UK asset.
Scenario 2: Algarve Holiday Let
Holiday lets can generate higher income during peak seasons but also come with greater running costs and the risk of seasonal vacancies.
Let's see how it plays out for an apartment in the Algarve:
- Total Property Cost: €320,000
- Annual Rental Income: €28,000 (assuming a realistic 65% occupancy)
- Annual Operating Costs: €8,000 (for management, cleaning, utilities, marketing)
- Total Cash Invested (30% Deposit + Fees): €106,000
- Annual Mortgage Payments: €10,000
This gives a strong Gross Yield of 8.8%. But once we factor in the higher running costs, the Net Yield drops to 6.3%. The real story, though, is the Cash-on-Cash Return, which lands at an impressive 9.4%, demonstrating the power of leveraged short-term rentals. To see how these yields stack up globally, take a look at our guide on rental yield by country.
Scenario 3: Istanbul Buy-to-Let
Emerging markets like Istanbul often promise lower entry prices and eye-catching gross yields, but they also introduce greater currency risk and economic volatility.
Here’s the breakdown for an Istanbul apartment:
- Total Property Cost: €130,000 (converted for comparison)
- Annual Rental Income: €9,600
- Annual Operating Costs: €2,000
- Total Cash Invested (50% Deposit + Fees): €70,000
- Annual Mortgage Payments: €4,500
The numbers show a Gross Yield of 7.4% and a Net Yield of 5.8%. However, the Cash-on-Cash Return comes in at 4.4%. While the headline yields look good, the final return on cash is lower, partly because a higher cash deposit is often required from foreign buyers.
Comparative Yield Analysis: UK vs International Markets
This table pulls our three scenarios together, offering a side-by-side look at how location, property type, and market dynamics shape returns. It shows exactly why investors must look beyond headline figures and focus on the numbers that truly matter to their bottom line.
| Metric | Manchester UK (City Flat) | Algarve Portugal (Holiday Let) | Istanbul Turkey (Buy-to-Let) |
|---|---|---|---|
| Gross Yield | 6.0% | 8.8% | 7.4% |
| Net Yield | 4.7% | 6.3% | 5.8% |
| Cash-on-Cash Return | 5.5% | 9.4% | 4.4% |
Key Takeaway: The strongest investment is not always the one with the highest gross yield. The Algarve holiday let, despite its higher running costs, delivers the best return on the actual cash invested. This illustrates why astute investors always dig deeper than surface-level numbers.
How to Refine Your Calculations for Real-World Scenarios
A quick calculation provides a useful snapshot, but it is only the beginning. Seasoned investors know that a property’s real performance is shaped by forces that go beyond the purchase price and initial rent. To build a reliable financial forecast, you must account for real-world complexities.
This means moving beyond static numbers and thinking critically about the variables that will inevitably impact your returns. It is about planning for void periods, budgeting for future repairs, and understanding how economic trends will affect your income over the long term.
Accounting for Void Periods
A common mistake new investors make is assuming uninterrupted rental income. In reality, every property will have void periods—the empty weeks or months between tenancies. Ignoring this gap will produce a dangerously optimistic net yield.
A prudent approach is to build a vacancy buffer into your annual forecast. A conservative rule of thumb is to budget for one month of lost rent each year, which works out to an occupancy rate of approximately 92%. On a property generating £1,500 per month, that adjustment immediately drops your expected annual income from £18,000 to £16,500.
Budgeting for Maintenance and Repairs
Another critical refinement is setting aside a realistic budget for maintenance. Properties require constant attention, from small fixes to major jobs like replacing a boiler. Hoping for the best is not a strategy; it is a financial risk.
A widely used guideline is to earmark 1% of the property’s value each year for maintenance. For a £300,000 property, that means putting aside £3,000 a year, or £250 a month. This "sinking fund" ensures you have cash ready when unexpected costs arise, protecting your cash flow and keeping your net yield figures honest. You can learn more about managing these costs in our guide to handling overseas rental income.
Factoring in Rental Inflation and Growth
Your rental income should not remain static; it should grow over time. Factoring in rental inflation is essential for projecting long-term returns and understanding the future power of your investment.
In the UK, for example, rental trends have seen significant movement. According to the Office for National Statistics, average UK private rents increased substantially in recent years. Regional variations are significant; for instance, London's rental growth often follows a different trajectory to that of other major UK cities. Knowing these local trends allows you to project future cash flow with far greater accuracy. You can find more detailed data on UK rental price trends on the ONS website.
By modelling even a conservative annual rent increase—say, 3-4% based on historical averages—you can see how your yield-on-cost grows significantly over a 5 or 10-year period, transforming a good investment into a great one.
By layering these real-world variables onto your initial numbers, you move past the limits of basic online tools. This refined approach allows you to stress-test your investment against genuine risks and build a more accurate forecast for its long-term performance.
Common Mistakes to Avoid When Calculating Yield
A rental yield calculator is a powerful tool, but it is only as accurate as the data you provide. Simple input errors can lead to costly misjudgements, turning what looks like a great deal on paper into a financial liability.
Even experienced investors can fall into traps that paint an overly optimistic picture. Getting the numbers wrong at the outset is one of the easiest ways to lose money in property, so avoiding these mistakes is essential for protecting your capital.
The most frequent error is mistaking an impressive gross yield for actual profit. An 8% gross yield might catch your eye, but it means very little until you subtract every associated cost. A high gross yield can be quickly eroded by hefty service charges or maintenance, leaving you with a net return that barely covers the mortgage.
Your real profit is what remains after every single expense is paid. Always focus on the net yield calculation, as it’s the only true measure of an investment’s ability to generate positive cash flow.
Forgetting One-Off Purchase Costs
A critical oversight is failing to include all acquisition costs in your total investment figure. The property's purchase price is just the starting point. Your total capital outlay must also include everything it took to get the keys and make the property tenant-ready.
Consider Stamp Duty Land Tax (SDLT), legal fees, survey costs, and any initial refurbishment work. On a £300,000 property in England, the SDLT for an additional home could be £14,000 or more. Forgetting to add this, along with another £5,000 in legal and renovation costs, will artificially inflate your calculated yield. This simple mistake can turn a projected 5% net yield into a real-world 4.6%.
Underestimating Ongoing Expenses
Another major pitfall is underestimating the true cost of owning and managing a property. You must budget realistically for all operational spending, not just the obvious bills.
Commonly overlooked or underestimated costs include:
- Maintenance and Repairs: Set aside at least 1% of the property’s value annually. For a £250,000 property, that's a £2,500 repair fund each year.
- Letting Agent Fees: These typically range from 8% to 15% of the monthly rent and will take a significant bite out of your net income.
- Void Periods: No property is occupied 100% of the time. Factoring in at least one month of vacancy per year provides a much more realistic income projection.
- Ground Rent and Service Charges: For leasehold properties, these can be substantial and are often subject to increases.
When you diligently account for every upfront and ongoing cost, your rental yield calculator becomes a tool for accurate analysis rather than a source of false confidence. This disciplined approach is fundamental to building a resilient and profitable property portfolio.
Investor FAQs: Interpreting Your Rental Yield
Right, you’ve run the numbers through a rental yield calculator, but what do they actually mean? Even after you get the hang of the formulas, the real skill lies in interpreting those percentages in the real world. Let's tackle some of the most common questions that crop up.
What Is a Good Rental Yield?
There is no single magic number. A “good” rental yield depends entirely on the market, the property type, and your investment objectives.
In many stable UK markets, investors often aim for a net rental yield between 5% and 8%. This range is generally seen as providing healthy cash flow after all running costs are paid.
In a prime London postcode, a net yield of 3-4% might be acceptable. Here, the primary driver for investment is often long-term capital growth, not immediate income. Conversely, for a higher-risk strategy like a House in Multiple Occupation (HMO), you would want to see net yields of 10% or more to justify the additional management and risk.
A "good" yield is one that aligns with your financial goals. It is always a trade-off between immediate cash flow, future growth potential, and the level of risk you are comfortable taking.
How Often Should I Recalculate My Property's Yield?
At a minimum, you should review your property’s performance annually. This annual review is crucial for tracking performance and deciding if the asset is still working hard enough for you.
An annual recalculation allows you to:
- Factor in rent increases: As you adjust rent in line with the market, your yield should improve.
- Account for changing costs: Insurance premiums, service charges, and repair budgets rarely stand still.
- Re-evaluate against market value: Your yield will shift as your property's value changes.
Think of it as an annual MOT for your investment. It helps you spot problems early and ensures the property is still pulling its weight.
How Do I Calculate Yield for a Holiday Let?
Calculating the yield for a holiday let requires a more detailed approach. The basic formula remains the same, but income and expenses are far more variable.
- Income: Instead of fixed monthly rent, you must estimate your total annual income based on seasonal nightly rates and a realistic occupancy rate. Research local tourism data to arrive at an accurate figure, such as 60-70%, rather than assuming full occupancy.
- Expenses: The running costs for short-term lets are significantly higher. You must budget for everything from booking site fees (Airbnb, etc.) and professional cleaning between guests, to higher utility bills and more frequent maintenance from greater wear and tear.
A rental yield calculator used for holiday lets must account for this volatile income and higher cost base to produce a credible profitability forecast.
At World Property Investor, we provide the data-driven guides and market analyses you need to confidently assess investment opportunities across the globe. From rental yield breakdowns in the UK to buying guides for emerging markets, our resources empower you to make smarter, more profitable decisions. Explore our insights at https://www.worldpropertyinvestor.com.