Most advice on uk vs usa property investing gets the decision wrong. It treats the question as if one country must be better.
For serious investors, that is the wrong frame. The UK and the USA reward different behaviours, different holding periods, and different return targets. One market tends to suit investors who prioritise income density and tighter underwriting discipline. The other suits investors who want scale, market variety, and stronger capital growth potential in selected corridors.
The practical question is not “Which market wins?” It is “Which market fits the job this capital needs to do?”
A pension-led investor may prefer dependable cash flow from a compact, supply-constrained market. A growth-oriented investor may accept more operational complexity in exchange for access to deeper regional diversification. A cross-border buyer with limited capital may value lower entry points in UK regional cities. Another may prefer the strategic breadth of the US, where one country contains multiple distinct property economies.
That is the lens to use throughout. If you are still defining your property strategy, this guide on how to invest in property is a useful starting point before comparing jurisdictions.
Choosing Your Market UK vs USA Investment Fundamentals
The cleanest way to think about uk vs usa is as a choice between two investment philosophies.
The UK is a scarcity market. Land is limited, major employment centres are densely used, and planning constraints matter. That tends to support rental demand and makes local knowledge especially valuable.
The US is a breadth market. Investors can move across a far wider set of regional economies, housing types, and price bands. That creates more opportunity, but also more dispersion between strong and weak locations.
Here is the early comparison that matters most.
| Factor | UK | USA | Investor implication |
|---|---|---|---|
| Market character | Compact, supply-constrained | Large, regionally diverse | UK suits focused city selection. US suits portfolio spread. |
| Typical strength | Higher net rental yield in many regional markets | Stronger capital growth potential in selected growth corridors | Match the market to your income or growth objective |
| Key friction | Stamp Duty and regulation | Property taxes, insurance, state-by-state variation | Net return depends on local execution |
| Best fit | Cash-flow buyers, yield seekers, smaller-ticket diversification | Growth buyers, larger-scale investors, market rotators | Strategy should lead geography, not the reverse |
What experienced investors often overlook
Many buyers compare gross yields and stop there. That is a mistake.
A market with a lower headline yield can still underperform after taxes, insurance, and sale-related deductions. Equally, a market with stronger macro growth can still disappoint if the investor buys in the wrong submarket or uses the wrong holding structure.
Key takeaway: In uk vs usa investing, the smarter comparison is not country against country. It is net income profile versus capital growth profile, adjusted for friction costs and execution risk.
That is why the rest of the analysis focuses on fundamentals first, then returns, then the leakages that sit between a good-looking deal and a good actual outcome.
Macro-Economic Drivers and Market Structure
The biggest difference between the two markets is physical before it is financial.

The United States is approximately 3,937% larger than the United Kingdom, with 9,833,517 square kilometres against the UK’s 243,610 square kilometres, according to this United States and United Kingdom size comparison. That same comparison shows the UK at 284 people per square kilometre versus 35 people per square kilometre in the US.
That single contrast shapes everything else. In the UK, space is competed for intensely. In the US, investors can choose from a much broader spread of urban, suburban, logistics, and peripheral markets.
Why density changes investment behaviour
In Britain, density compresses distance between jobs, transport links, and housing demand. Investors often succeed by buying in cities where demand is structurally durable and supply remains difficult to expand quickly.
That can favour smaller flats, HMOs in the right regulatory context, and regional city buy-to-let stock with dependable occupancy. It also means planning, local authority rules, and tenant regulation deserve more attention than many overseas buyers expect.
In the US, geography creates a different toolkit. The market includes high-growth metros, mature gateway cities, suburban expansion zones, and lower-cost income markets. That variety gives investors more room to tailor a portfolio.
The trade-off is complexity. A national view is rarely enough. State-level and city-level conditions matter more.
Income and economic depth
Income levels help explain why American assets can support higher pricing in stronger metros. In 2024, US GDP per capita was $84,534 compared with $53,246 in the UK, a 58% higher income level, based on this UK versus US economic comparison.
That matters for property in two ways. First, higher incomes can support stronger purchasing power and deeper rental affordability in prime employment markets. Second, they can also push entry prices higher, which raises the capital required to buy well-located assets.
For investors, the implication is straightforward:
- UK markets often allow a more income-led strategy with lower individual lot sizes.
- US markets often reward investors who can target economic momentum and wait for growth to compound.
A broader market outlook helps when turning those macro drivers into acquisition plans. This property market forecast for 2025 is useful for framing where global trends may support either approach.
The structure of each economy matters
The US benefits from a broader economic base. Tech, energy, logistics, healthcare, and finance do not move in lockstep. That helps create multiple property cycles inside one national market.
The UK is smaller and more concentrated. London remains dominant in global capital terms, while regional cities often carry the strongest income case. That split is useful. It means UK investors can choose between prestige and cash flow with clearer trade-offs.
Investor reading of the macro picture: The UK tends to offer scarcity-backed rental economics. The US tends to offer scale-backed optionality. Scarcity can support income. Optionality can support growth.
Comparing Capital Growth and Rental Yields
The common framing in uk vs usa property investing misses the investor question that matters. The decision is rarely yield versus growth in the abstract. It is whether a given city can deliver acceptable net income after recurring costs while still offering a credible path to appreciation.
A US metro with stronger wage growth may justify a lower starting yield if rent growth and exit liquidity are materially better. A UK regional city with a higher initial yield may outperform on total return if operating costs are lower and the entry basis is disciplined. For institutional-style underwriting, country-level averages are only a starting screen.
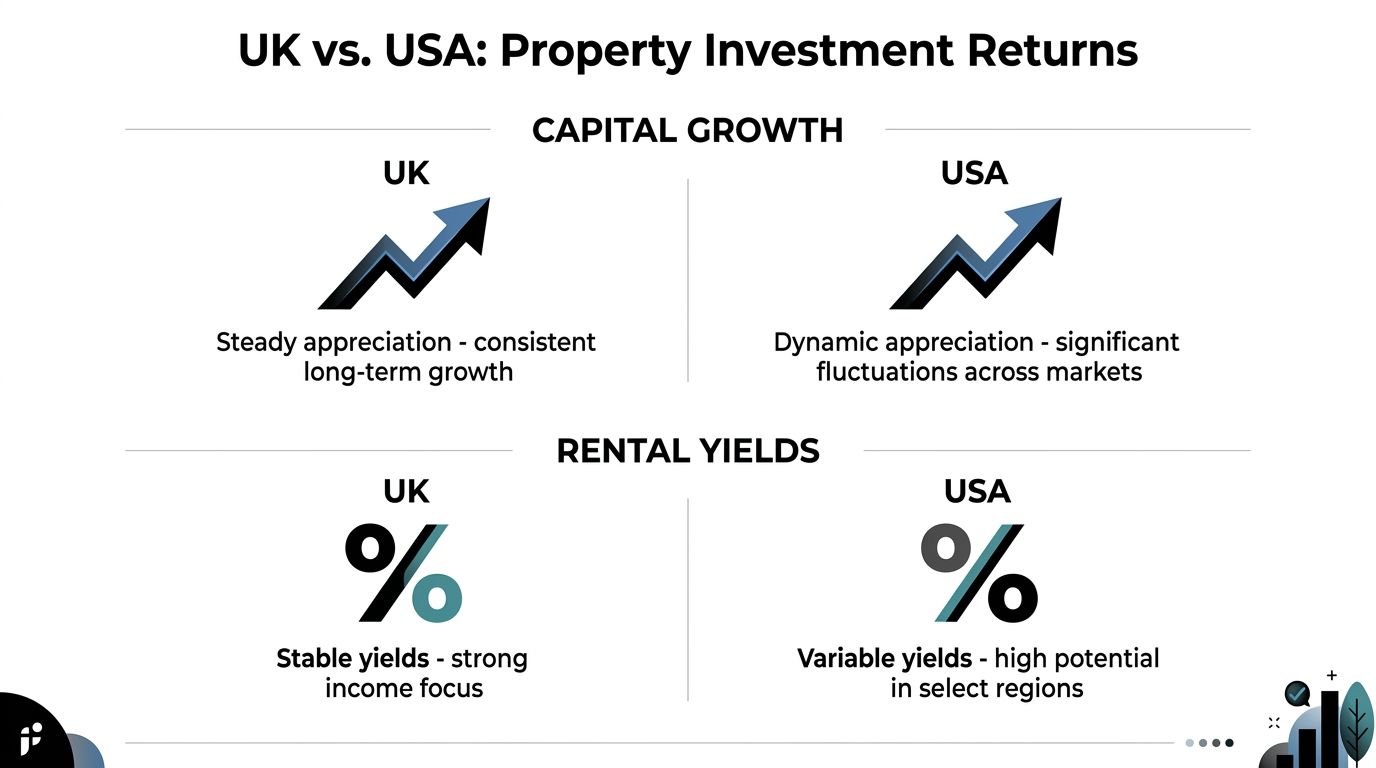
Capital growth is broader in the US, but more selective in the UK
The US market offers a wider set of cities where employment growth, business formation, and domestic migration can reinforce housing demand over several cycles. That breadth matters. It gives investors more ways to express a growth strategy, whether through Sun Belt population gains, logistics corridors, or innovation hubs with deep occupier demand.
The UK can still produce strong appreciation, but the pattern is tighter and easier to segment. Growth tends to concentrate in supply-constrained urban markets, especially where planning limits, transport links, and institutional capital support pricing. That creates a narrower opportunity set, but also a clearer one. Investors are usually choosing between income-led regional cities and a smaller group of scarcity-driven growth markets rather than scanning a continent-sized menu of metro economies.
The portfolio implication is straightforward. US exposure suits investors seeking multiple growth corridors and higher dispersion between winning and losing cities. UK exposure suits investors who prefer a shorter list of markets where supply discipline is easier to underwrite.
Net yield often gives the UK a stronger income case
Headline yield comparisons can be misleading because the gross figure is only the first line of the model. What matters is retained income after local taxes, insurance, management, void assumptions, and financing friction.
According to this comparison of UK and US property returns, UK buy-to-let gross yields averaged 7.2% in 2025, reaching 8.5% in northern cities, while the US national average was 6.1%. The same source notes that after US property taxes averaging 1.1% and higher insurance costs, net UK yields can be 1 to 2 percentage points higher for foreign investors.
That gap changes strategy selection. A US asset can still be the better investment if growth compensates for lower retained income. But for investors targeting immediate cash flow, especially those underwriting without aggressive rent growth assumptions, many UK regional markets start with an advantage.
| Return lens | UK | USA | Investor implication |
|---|---|---|---|
| Capital growth profile | More concentrated in supply-constrained cities | Broader set of growth corridors across metros | US offers more city-level optionality. UK requires tighter market selection |
| Gross rental yield | 7.2% average in 2025, with 8.5% in northern cities | 6.1% national average | UK often screens better for income at acquisition |
| Recurring cost drag | Lower annual holding-cost pressure in many cases | Property tax and insurance can materially erode cash flow | US underwriting needs more caution on net yield |
| Best fit by strategy | Income-focused holds, selective growth overlays | Growth-focused holds, with income secondary in some metros | Match city choice to portfolio objective, not country stereotypes |
For a clearer framework on screening income properly, use this guide to how rental yields are calculated and compared before underwriting either market.
A short visual summary helps:
The better market depends on the job you need the asset to do
A pension-style investor seeking durable cash flow may find that a UK regional allocation produces a cleaner income profile after costs. An investor with a longer hold period and a higher tolerance for income compression may prefer selected US metros where rent growth, liquidity, and exit rerating offer more upside.
Three conclusions follow.
- If current income is the priority, UK regional cities merit first review.
- If appreciation over a long hold period is the priority, selected US metros usually offer the stronger pipeline.
- If the portfolio needs both, a blended allocation often improves risk-adjusted returns more effectively than a single-country bet.
Underwriting rule: A deal that only looks attractive on gross yield usually fails a rigorous investment test. Model recurring costs first, then assess whether the city still fits the mandate.
Navigating Taxes and Transaction Costs
Gross yield is the marketing number. Net return is the investor number.

Foreign buyers often focus heavily on purchase price and rent. They spend less time on the points where profit leaks away. In uk vs usa, those leakages appear at different moments in the investment cycle.
Entry costs in the UK and holding costs in the US
The UK’s pain point is usually visible on day one. According to this review of recent UK and US investor rules, the key property issue for overseas buyers is the 2% Stamp Duty surcharge for foreign buyers.
The US often feels easier at the point of entry because the cost drag is spread differently. The pressure tends to build during the hold period through local property taxes, insurance, and state-by-state administrative complexity.
That difference changes how investors should think.
- In the UK, you need a clearer plan for how long you will hold the asset so the upfront friction is amortised over time.
- In the US, you need stronger annual underwriting because recurring costs can compress income.
- In both markets, poor assumptions at acquisition usually remain poor assumptions at exit.
Exit friction is not symmetrical
The same Wise analysis highlights a point many international buyers miss. In the US, FIRPTA requires a significant withholding on the gross sales price from a foreign seller.
That is not the same as tax due. It is a cash-flow event at sale, and that distinction matters. Investors who ignore it can find their exit proceeds temporarily constrained at exactly the point they expected liquidity.
The UK creates a different planning challenge. The main friction for many foreign investors is usually felt earlier, through stamp duty and ownership structuring decisions, rather than through the same kind of gross-sale withholding mechanism.
A simple underwriting checklist
When comparing a UK deal with a US deal, ask these questions before looking at projected return.
- How much friction hits upfront? In the UK, acquisition taxes may change the true entry basis materially.
- How much friction recurs annually? In the US, local taxes and insurance can keep eroding yield.
- What happens on sale? FIRPTA can affect cash timing and should be planned for from the start.
- Who is doing the compliance work? Cross-border investing is partly a tax exercise, not only a property exercise.
A useful reference point when modelling disposal is this explainer on capital gains tax on foreign property.
Tip: The better market on paper can become the worse market after acquisition costs, annual leakage, and exit withholding are all added to the model.
Financing Legal Frameworks and Residency Rules
The common assumption is that financing decides the market. In cross-border property, legal structure usually decides whether the projected return survives contact with reality.
For an overseas investor, the UK is typically easier to set up and underwrite. The legal concepts still need care, especially around freehold and leasehold, but foreign ownership rules are relatively clear and the transaction process is more standardised.
The US is a larger opportunity set with more moving parts. Real estate law is shaped by state and local practice, so title procedures, landlord obligations, disclosure rules, insurance requirements, and enforcement risk can vary materially from one city to the next. For portfolio construction, that means the country comparison is only the first screen. The operational burden sits at metro and state level.
Financing should support the strategy
Non-resident borrowing is available in both markets, but availability alone is not the investment case. The relevant question is what debt does to net yield after taxes, insurance, vacancies, compliance costs, and currency risk are added.
In the UK, debt often works best as a tool for preserving income efficiency in regional markets where yields start higher. In the US, borrowing can strengthen returns in growth-led cities, but it can expose weak underwriting faster because holding costs are more locally variable. An investor buying in Atlanta, Dallas, or Phoenix is making a financing decision and an operating-cost decision at the same time.
That distinction matters. Two assets with similar headline yields can produce very different post-finance outcomes if one sits in a jurisdiction with heavier insurance pressure, stricter landlord rules, or less predictable closing and title costs.
Legal structure is part of asset selection
In the UK, the legal review should focus on title length, service charges, ground rent where relevant, and the practical obligations attached to the tenancy model.
In the US, structure goes further. Investors need to decide how they will hold title, which state-specific rules apply, how local property management will handle compliance, and whether the market has risks that can erode cash flow even if rent growth is sound. Legal due diligence is therefore not a closing formality. It is part of city selection and return forecasting.
Institutional investors usually treat this as a filtering tool. Markets with attractive growth narratives but messy execution risk often deserve a higher required return, or no allocation at all.
Residency should stay separate from underwriting
Residency is a personal objective. Property is a capital allocation decision. Combining them too early often leads investors to overpay for a mediocre asset because the immigration story feels persuasive.
A better sequence is simple. Start with the visa route, then test whether the property still clears your required return after all costs. This guide to a visa route for property-focused investors is a useful starting point for that first step.
Investor rule: A property should qualify on yield, growth potential, and exit liquidity before residency benefits enter the discussion.
Top Investment Cities by Investor Strategy
Country-level analysis is useful, but property returns are local. The better question is not UK or USA in the abstract. It is which cities match the role the asset will play in the portfolio.

High-yield strategy
For pure income, UK regional cities often look stronger than the headlines suggest.
Liverpool stands out in this framework because the verified data places UK yields at their strongest in northern cities. Glasgow also belongs on the watchlist for investors who want deep tenant demand, urban density, and the chance to buy below London pricing.
In the US, the equivalent strategy usually points investors towards lower-cost markets rather than prestige metros. The challenge is that gross rent can look attractive while local taxes, insurance, and maintenance burden gradually reduce the result.
That makes city selection in the US more sensitive to operating assumptions than many overseas buyers expect.
Balanced growth and yield
Manchester fits this category well in the UK. It offers the logic many institutions like: a large regional economy, strong renter demand, and a profile that sits between pure income and pure prestige.
Birmingham can play a similar role. It is often less about spectacular upside and more about building a portfolio position in a major urban economy where rental demand is broad-based.
In the US, this slot usually belongs to diversified Sun Belt and large secondary metros. Dallas and Atlanta are typical examples in strategic terms because investors can combine population draw, broad employer mix, and multiple submarkets within the same metro area.
The edge the US offers here is optionality. The edge the UK offers is tighter market focus.
Blue-chip stability and long-horizon appreciation
London remains a global city first and a domestic market second. That gives it relevance even for investors who find regional UK yields more attractive elsewhere.
The South East broadly serves a similar purpose for buyers seeking liquidity, recognisable locations, and a lower-volatility profile relative to more aggressive strategies.
In the US, New York City and Boston fill the blue-chip role. These markets are not where investors go for easy yield. They are where they go for depth, prestige, and long-term demand tied to global capital and established sectors.
A strategy map rather than a leaderboard
| Investor goal | UK city profile | US city profile | Best use case |
|---|---|---|---|
| High rental yield | Northern regional cities such as Liverpool | Lower-cost income markets | Monthly cash-flow focus |
| Balanced return | Manchester, Birmingham | Atlanta, Dallas | Blend of income and growth |
| Blue-chip stability | London, South East | New York City, Boston | Wealth preservation and long hold |
The hidden lesson is that uk vs usa is not only a country choice. It is a city-tier choice.
Many investors compare London with all of America, or compare a low-cost US Midwest market with prime South East England. Those are mismatched comparisons. A better method is to compare role with role: income city against income city, balanced market against balanced market, and blue-chip market against blue-chip market.
Practical takeaway: Build your shortlist by strategy first, then by geography. That reduces the risk of buying a city for the wrong reason.
Worked Examples A UK vs USA Deal Analysed
A good comparison does not need invented precision. It needs disciplined logic.
Take two hypothetical investors with similar objectives but different priorities. One wants dependable income from a regional city. The other wants a stronger chance of long-run appreciation in a larger, faster-moving economy.
Example one UK regional income deal
The UK buyer targets a regional city in the North of England. The logic is straightforward. Verified yield data shows UK buy-to-let gross yields are often strong in northern cities.
That investor accepts heavier entry friction because the property is being bought for income retention over time. The underwriting focus is on purchase costs, management discipline, and whether the rent still looks attractive after compliance and maintenance.
The likely outcome is a deal that can produce a stronger net income profile than many overseas buyers expect, especially if the buyer avoids overpaying for new-build stock sold on marketing rather than local fundamentals.
Example two US growth-oriented deal
The US buyer targets a mainstream asset in a growth market. The thesis is different. It leans on stronger household income, broader economic diversity, and a greater possibility of appreciation.
That fits the macro picture. In 2024, US GDP per capita was higher than in the UK, indicating a stronger income level. For investors, that supports the idea that US assets often come with higher barriers to entry but can offer stronger capital growth potential.
The trade-off appears quickly in the model. The investor must carry more recurring uncertainty around taxes, insurance, and local operating conditions. The result may still be attractive, but the cash-flow margin for error is often thinner than the headline market story suggests.
What the side-by-side teaches
The UK deal is often better at doing one job well. It can deliver clearer income economics.
The US deal is often better at preserving upside. It gives the investor access to a larger set of macro and local growth drivers.
Neither is automatically superior. The UK investor is usually buying income efficiency. The US investor is usually buying optionality and appreciation exposure.
That is the primary lesson from worked comparisons. A portfolio builder should stop asking which market is better in the abstract and start asking which market performs the intended portfolio function more efficiently.
Final Verdict A Decision Framework for Your Portfolio
The decision in uk vs usa property investing becomes simpler when you force it through a portfolio lens.
If you want cash flow first, the UK deserves priority. Regional markets can offer stronger net income after costs, especially where pricing stays moderate and rental demand is durable.
If you want capital growth first, the US deserves priority. Its economic breadth, faster growth profile, and wider set of city-level opportunities create a better hunting ground for appreciation.
If you want diversification, the strongest answer may be both. Use the UK for income and the US for growth. That is not fence-sitting. It is role-based allocation.
Use these questions before you buy
- Do I need income now or wealth growth later? Income points towards the UK. Long-duration growth points towards selected US metros.
- How much friction can I absorb upfront? UK entry costs matter. US recurring ownership costs matter.
- Can I manage local complexity? The US offers more choice, but also more variation in law, taxes, and operating conditions.
- Is this a one-asset decision or a portfolio decision? The right answer for a first acquisition may differ from the right answer for a fifth.
The cleanest investor match
| Investor profile | Better fit |
|---|---|
| Income-focused landlord | UK regional cities |
| Growth-focused long-hold investor | Selected US metros |
| Cross-border diversifier | Blend both markets |
| Buyer with limited capital seeking multiple assets | Often UK first |
| Buyer comfortable with complexity in exchange for broader opportunity | Often USA first |
The best market is the one that lets your capital do its intended job with the least avoidable friction.
If you want help comparing countries, cities, yields, taxes, and buying rules before committing capital, explore the research tools and market guides at World Property Investor.