A one-bedroom flat in central London averages £2,189.71 per month, while average monthly net salary sits at £3,643.64 according to Wise’s London cost of living data. That single ratio explains more about the cost to live in London than most relocation guides do. For an investor, it is not just a lifestyle number. It is a stress test for tenant affordability, rent collection reliability, and yield resilience.
London remains one of the world’s premier financial and property markets. It also imposes a living-cost burden that changes how prudent investors should underwrite deals. High rents do not automatically produce strong returns. In many cases, they signal the opposite. A market can charge premium rents and still offer compressed yields once purchase prices, financing, tax, and tenant affordability are accounted for.
That is the lens that matters. Not whether London is expensive, which is obvious. The important question is how living costs affect demand quality, tenant stability, and cash flow durability. Investors comparing London with other established hubs, or with emerging markets promising higher headline yields, need to translate household budgets into investment signals.
For a broader macro context on cross-border opportunities, this 2025 property investment overview is a useful benchmark. London deserves a place in that discussion, but only when the numbers are read properly.
London's Cost of Living An Investor's Introduction
Most articles on the cost to live in London stop at rent, transport, and groceries. That is useful for tenants. It is incomplete for investors.
A landlord is exposed not only to the rent level, but also to the tenant’s full monthly cost stack. If housing absorbs too much income, arrears risk rises. If non-housing costs climb faster than wages, tenant retention weakens. If purchase prices outrun achievable rents, gross yield compresses even while the market looks expensive on paper.
Why London’s costs matter to investors
London sits in a category of its own within the UK. Housing is the dominant line item, and the city carries a Cost of Living Index of 81.4 and a Rent Index of 68.4 in the Wise dataset, well above cities such as Edinburgh and Manchester in the same source. That matters because investors are not buying an isolated unit. They are buying into a local affordability system.
The system has two competing strengths.
First, London still benefits from deep employment demand, higher salaries, and global status. Second, that same success pushes living costs to levels that leave little margin in many household budgets.
The key investor mistake
Many overseas buyers see high nominal rents and assume strong income returns follow. In London, that assumption often fails.
Key takeaway: In London, the cost to live in the city is not just a consumer issue. It is a pricing constraint on your tenant base and a direct input into net yield.
The right way to read London is as a premium market with strong demand, but one where affordability pressure can narrow the gap between a good-looking headline rent and a mediocre investment outcome.
The Macro View On London Living Costs in 2026
London’s living-cost profile is structurally different from the rest of urban Britain. That distinction matters because investors are underwriting local wages, local household resilience, and local demand depth, not merely buying a postcode.
London’s cost premium is systemic
The Minimum Income Standard for a decent living in London has roughly doubled for single working-age adults since 2014. It now costs 78% more in Inner London and 58% more in Outer London than the rest of urban UK, according to Trust for London’s Minimum Income Standard research. The same source states that around 50% of Londoners do not earn that standard.
That has an important investment implication. Demand for rental housing is strong, but affordability is weak across a large share of the tenant pool. A market can therefore produce strong occupancy and fragile household finances at the same time.
For readers tracking wider market direction, this 2025 property market forecast provides useful strategic context.
What sustains such high costs
London’s costs are not random. They reflect a concentration of high-value employment, international capital, and chronic housing pressure. The city also benefits from wages that outpace much of the UK. Verified data shows London weekly gross wages at £950, around 30% higher than regions such as Wales in the Wise dataset.
Higher pay supports higher rent ceilings. But it does not eliminate affordability stress.
The same verified data also notes that a £60,000 salary yields £3,654 take-home monthly, while solo living in Zones 1-3 can run to £3,200-£3,500 per month according to the Essential Living figures included in the verified dataset. That is a narrow cushion for a professional salary that many global investors would consider strong.
Inflation still matters even in a high-income city
London’s premium status does not insulate households from cost pressure. The verified dataset notes 3.0% CPI and 3.2% CPIH in early 2026, alongside 4.2% earnings growth. On paper that suggests modest real improvement. In practice, households facing steep rent, childcare, and transport bills still have limited flexibility.
The Trust for London tracker data in the verified section adds another layer. Lowest-income quintile households faced a 34% expenditure surge since 2020 to maintain pre-pandemic living standards. For investors, that is not background noise. It affects renewal negotiations, arrears risk, and tenant turnover.
Investor reading: London’s cost premium is supported by real economic depth, but it also narrows the pool of households with comfortable rental headroom.
The macro signal for landlords
The headline conclusion is nuanced.
London remains attractive because jobs, global relevance, and supply constraints continue to support rental demand. Yet the same data shows a market where affordability has deteriorated more sharply than many investors assume. That combination favours disciplined underwriting over prestige-led buying.
In practical terms, investors should focus less on whether London is expensive and more on which tenant cohort can still afford a given asset without strain.
A Zonal Breakdown Of London's Property Market
The London market does not operate as one rental market. It functions as a series of linked sub-markets shaped by commuting patterns, local wage profiles, and the value tenants place on access to the City, Canary Wharf, and other employment hubs.
Zones 1 and 2 command the prestige premium
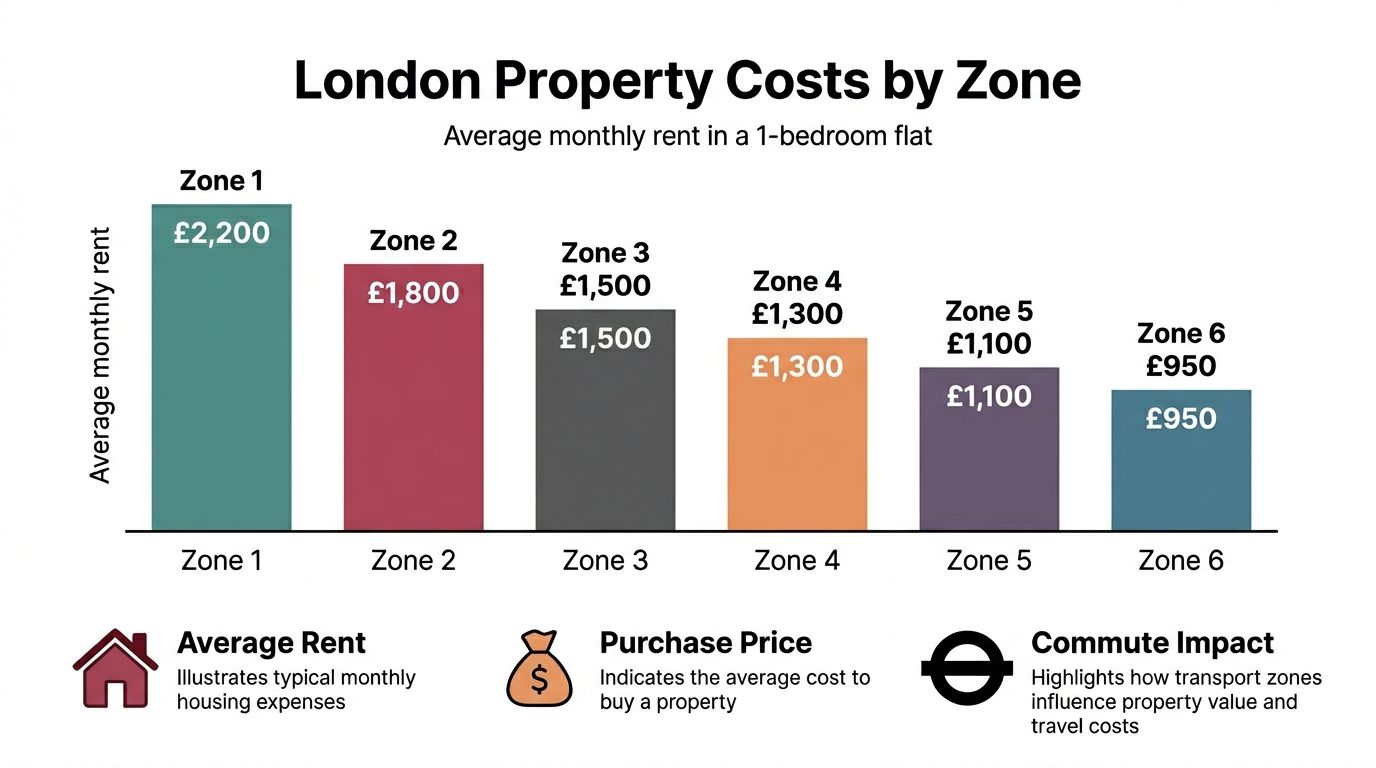
Verified data shows 1-bedroom apartments in Zones 1-2 averaging £2,200-£2,400 monthly in early 2026, while Zones 3-6 average £1,750-£2,050, according to Numbeo’s London cost of living page. That gradient is the cleanest summary of how London prices convenience.
Central zones attract tenants who value time savings, proximity to major employers, and urban amenities. Investors benefit from stronger nominal rent levels, but they pay heavily for entry. The verified data also places city-centre purchase prices at £1,230.04 per square foot on average, with a range up to £1,858.05, while equivalent figures outside the centre average £753.71 per square foot.
That spread explains why central London often looks better on a rent chart than on a yield model.
If you want a broader price reference point, this guide to the average price of a flat in London helps frame the purchase side.
Zones 3 to 6 offer a different investment logic
Outer zones matter because they shift the balance between affordability and rent collection quality.
Verified data highlights Zones 3-6 one-bed rents at £1,750-£2,050 and also notes an Oyster card Zones 1-6 cost of £2,000 per year. That transport cost is significant, but many tenants still choose outer zones because the rent discount outweighs the commuting burden.
Here, investors often find a better match between what a property costs to buy and what the local tenant base can sustain month after month.
Reading the map like an analyst
The most useful way to segment London is not “prime” versus “non-prime”. It is by the relationship between three variables:
| Zone grouping | Rent profile | Purchase price profile | Investor reading |
|---|---|---|---|
| Zones 1-2 | Highest | Highest | Prestige and liquidity, but more yield compression |
| Zones 3-4 | Lower than core central areas | More accessible | Often the clearest balance of rent, transport, and affordability |
| Zones 5-6 | Lower still | Lower entry point | Better value cases where transport links and local demand are strong |
The practical zonal trade-off
A central flat can attract a higher-income tenant, but it can also sit in a market where acquisition costs are so high that cash flow disappoints. An outer-zone flat can charge less rent, yet still deliver a stronger return if the purchase basis is materially lower and tenant affordability is healthier.
Practical test: Ask which zone gives your target tenant enough remaining monthly income after rent to absorb utilities, commuting, and normal cost inflation.
Flat shares and access points
The verified dataset adds one important detail often overlooked by investors: flat-shares run at £750-£1,250 per month in early 2026. That is not a fringe product. It is a major affordability valve in London’s housing ecosystem.
For landlords, this matters in two ways. Shared accommodation can widen the viable tenant pool. It also shows how far many residents must adapt their housing choice to remain in the city.
The cost to live in London therefore changes by zone, but also by unit type. Investors who ignore that second layer can misread demand.
Beyond Rent Deconstructing Daily And Monthly Expenses
Rent gets the attention. It should not get all of it.
A tenant can manage a premium rent only if the rest of the monthly budget remains workable. In London, non-rent costs are high enough that they should be built into any serious affordability assessment.
The baseline non-rent budget
Verified data gives a clean city-wide reference point. Single-person living expenses excluding rent are £1,110.40 per month, while monthly costs excluding rent for a family of four are £3,913.20, based on the verified Numbeo figures cited through Wise and Trust for London data.
Those numbers are not a full personal budget for every household. They are a baseline. Investors should treat them as the amount that exists before discretionary upgrades, school fees, relocation friction, or lifestyle-heavy spending.
Estimated monthly costs in London excluding rent
| Expense Category | Single Person (Est. Monthly Cost) | Family of Four (Est. Monthly Cost) |
|---|---|---|
| Overall non-rent living costs | £1,110.40 | £3,913.20 |
The verified data does not provide an authorised numerical breakdown by groceries, utilities, telecoms, or council tax. That means the responsible analytical approach is qualitative.
What sits inside that monthly burden
Utilities and council tax
Utilities and local taxes vary by property size, tenure structure, and borough. A landlord cannot assume that a lower rent automatically means a low all-in cost to the occupier. Older buildings, larger homes, and certain borough tax bands can materially change the tenant’s monthly outgoings.
For investors, the practical point is simple. A tenant under stress does not separate rent from the rest of the household budget. If utilities rise or council tax resets, rental affordability worsens even when contractual rent stays unchanged.
Transport
Transport costs influence where demand settles. The verified dataset notes £2,000 per year for Oyster Zones 1-6. That figure is useful because it highlights the trade-off many households make. They accept a longer commute in exchange for lower rent, but only up to a point.
If a property is poorly connected, the rent discount may not be enough. If it is well connected, outer zones can become materially more investable.
Childcare and commuting for families
International buyers often underestimate family budgets. The verified data notes that parents in Outer London face 16% higher childcare costs, with childcare at £308.79 per week, alongside higher commuting costs, according to the uhomes material included in the verified section. That changes the family affordability equation quickly.
Key point for landlords: Family housing demand can look stable, but the occupier’s real budget may be more constrained than the headline household income suggests.
How to use these costs in screening
A practical affordability review should ask:
- Income durability: Is the applicant’s income fixed, variable, or bonus-dependent?
- Commute burden: Does the property force a costly or complex travel pattern?
- Household composition: A single professional and a family absorb cost increases very differently.
- Lifestyle flexibility: A flat-share tenant can cut housing cost more easily than a family in a larger unit.
The cost to live in London is therefore not one figure. It is a layered budget structure, and landlords who underwrite only the rent line are missing the core risk.
Sample Budgets And Required Salary Benchmarks
The most useful way to understand London is to view it through real tenant profiles. Household type determines not only what rent is affordable, but also how much shock absorption exists if costs rise.
A useful market sense-check sits in the verified data from Wise. With a one-bedroom city-centre apartment at £2,189 and essential living costs around £1,110, a single person needs net monthly income of over £3,300. Against an average London net salary of £3,643, that leaves little headroom, as shown in Wise’s London guide.
To model deal resilience, a rental yield calculator can help align tenant budgets with expected income.
Profile one. Single professional in a Zone 2 flat-share
This is one of the more resilient tenant profiles in London because the occupier uses shared housing to preserve disposable income.
Verified data places flat-shares at £750-£1,250 per month. Add the verified baseline £1,110.40 for non-rent costs, and the total monthly cost lands in a broad but realistic range of £1,860.40 to £2,360.40 before lifestyle upgrades.
That structure explains why shared accommodation remains central to London’s rental market. It protects affordability without requiring the tenant to leave higher-demand parts of the city.
Profile two. Professional couple in an outer zone rental
The verified data does not provide a separate authorised budget for two adults, so the right approach is directional rather than falsely precise.
A couple renting in Zones 3-6, where one-bedroom rents average £1,750-£2,050, can split the housing burden more effectively than a single tenant. Even so, that household still faces London’s elevated non-rent cost base and must absorb commuting and utility expenses as a shared unit.
This is often one of the strongest mainstream tenant groups from an investor perspective. Two incomes usually create more resilience than one, and outer-zone pricing can keep the rent-to-income burden more manageable.
Profile three. Family with childcare in Outer London
With childcare in Outer London. Here, the cost stack becomes more challenging.
The verified dataset notes family-of-four non-rent monthly costs at £3,913.20, and separately highlights childcare at £308.79 per week in Outer London for affected households. It also notes higher commuting costs. Family budgets therefore tighten quickly even outside prime central areas.
For investors in larger units, household income alone is not enough. The relevant question is how much of that income remains after childcare and transport.
Salary benchmarks investors should watch
The verified data provides several anchor points:
| Benchmark | Verified figure |
|---|---|
| Average London monthly net salary | £3,643.64 |
| £60,000 salary take-home per month | £3,654 |
| Median salary net per month | A lower figure than the average |
These figures reveal something important. The average earner is close to the threshold where a central one-bed plus normal living costs consumes most of monthly income. Median earners face tighter constraints still.
Leasing implication: Tenant income verification matters most in the segment where a property’s rent competes with the city’s baseline cost stack, not just with other listings.
What kind of tenant can afford what
A rough strategic reading follows:
- Flat-share stock suits younger professionals and mobile renters preserving affordability.
- Outer-zone one-beds fit stronger single incomes or couples combining earnings.
- Family housing requires much closer scrutiny of childcare, commute pattern, and total household outgoings.
The cost to live in London therefore acts as a filtering mechanism. It determines which tenant types can occupy which assets without operating on a financial knife-edge.
Analysing The Investment Implications Of London's Costs
The biggest analytical error in the London market is assuming that high rent equals high return. It often does not.
The rental yield paradox
Verified data for property investors states that London presents a rental yield paradox. Rents are high, but purchase prices are also high, often resulting in gross yields below 4–5% in prime areas, according to Trust for London’s rent affordability housing data. The same verified data notes that nearly 40% of London’s children live in poverty, signalling how stretched rent-to-income ratios already are.
That combination should change how investors interpret premium locations. Prime areas may offer status, liquidity, and long-term appeal, but current income return can be thinner than expected.
For a deeper city-specific yield lens, this guide on London rental yield is a useful reference point.
Why high living costs compress returns
There are three main channels.
High acquisition cost
Verified data places city-centre purchase prices far above those outside the centre. That means investors start from a higher capital basis before legal costs, financing, or management.
Financing cost
The verified dataset includes 5.29% mortgage rates for a 20-year fixed in one source context and 4.68% 20-year fixed in another. Either way, debt is expensive enough that investors must test whether rental income still covers financing comfortably.
Tenant affordability limits
A landlord cannot raise rents indefinitely merely because London is globally desirable. The tenant’s salary and non-rent cost burden impose a ceiling. In other words, the city’s cost premium supports rents up to a point, then begins to undermine them by weakening affordability.
Prime versus outer London
Prime central assets often suit investors who prioritise capital preservation, international recognisability, and long-term wealth parking. They are less compelling for income-led buyers if the underwriting depends on strong cash flow from day one.
Outer zones often offer a different proposition. Verified data explicitly notes opportunities for investors targeting outer zones for superior cash-on-cash returns, because rent discounts are smaller than purchase price discounts in relative terms.
The investor risks that living-cost data reveals
- Arrears exposure: If a tenant’s budget has little headroom, even modest cost increases can disrupt payment discipline.
- Void risk: Tenants may relocate to cheaper zones or shared housing if their all-in budget becomes unworkable.
- Renewal friction: Rent increases become harder to implement where household affordability is already stretched.
- Yield illusion: A strong headline rent can disguise a weak return on total capital deployed.
Analyst’s view: London works best when the buyer is clear about strategy. Prestige-led purchases and income-led purchases are often not the same deal.
A disciplined underwriting approach
A prudent investor in London should calculate:
- Gross yield from annual rent divided by total acquisition cost.
- Debt service resilience under realistic mortgage assumptions.
- Tenant affordability using household type, not just salary headline.
- Net position after management, tax, maintenance, and vacancy allowances.
The cost to live in London belongs inside that model. It determines how much pricing power a landlord has, and whether a seemingly premium asset can sustain dependable income over time.
Actionable Checklists For Investors And Expats
London rewards preparation. It punishes assumptions.
The city’s cost structure means investors and relocating buyers need a more detailed checklist than they might use in lower-cost markets. Standard guides often miss the items that change the viability of the deal or the move.
Checklist for buy-to-let investors
Model the tenant’s full affordability, not just rent. Use verified rent data together with the city’s non-rent cost base. A tenant who can technically pay the first month may still be financially stretched over the term.
Stress-test the debt. The verified dataset includes mortgage pricing that is high enough to matter materially to cash flow. If the deal only works under optimistic assumptions, it is fragile.
Separate prestige from income. Central London can still make sense for wealth preservation or long-horizon positioning. It is not automatically the best answer for current income.
Screen by tenant type. A flat-share, a professional couple, and a family all interact with London’s cost burden differently. Match the unit to the right occupier profile.
Check local transport value. Outer-zone investments work best where commute friction is low enough that tenants still see value after paying for travel.
Underwrite rent growth cautiously. Affordability pressure limits landlord pricing power more than many overseas buyers expect.
Checklist for expats and relocating professionals
The verified dataset notes that standard cost guides often understate the full burden for international buyers. It specifically highlights Outer London childcare costs that are 16% higher at £308.79 per week, plus higher commuting costs, in the uhomes material included in the verified data. That is the type of detail that changes relocation economics.
Build an all-in budget. Housing is only the starting point. Add commuting, childcare, and setup friction before deciding what area is affordable.
Choose the zone based on the full monthly package. A lower rent further out may still be the better option if the transport link is strong. The reverse can also be true.
Plan for family-specific costs early. Childcare can alter the viability of a move more than rent differences between two neighbourhoods.
Review property type, not just postcode. Shared housing, smaller units, and newer developments can create very different monthly outcomes.
Keep liquidity after move-in. London’s cost profile leaves less room for error than many relocating professionals expect.
Final practical reading
The cost to live in London does not make the city uninvestable. It makes it selective.
The strongest opportunities tend to sit where three conditions overlap: the purchase basis is sensible, the transport proposition is strong, and the target tenant still has enough room in their monthly budget to remain stable. That often points away from the most obvious trophy assets and towards the sub-markets where affordability and access still align.
If you are buying for yield, underwrite like a credit analyst. If you are relocating, budget like a risk manager.
World Property Investor publishes data-led market guides, yield analysis, and country-by-country property research for global buyers comparing London with other established and emerging markets. Explore more at World Property Investor.