
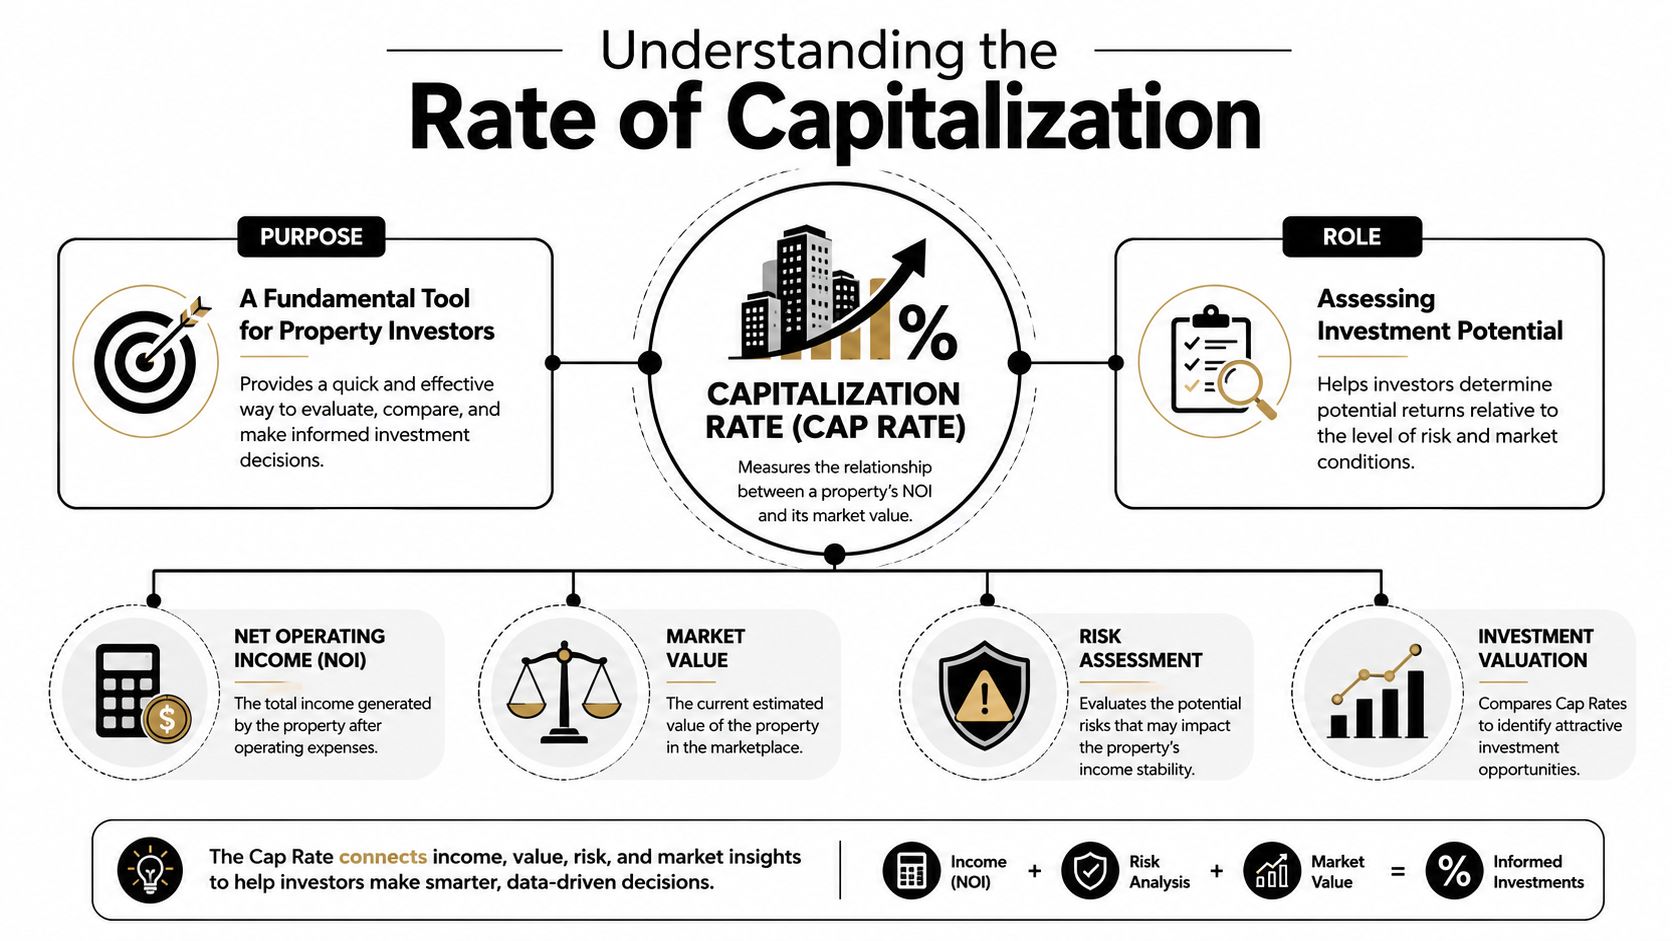
The rate of capitalization is the annual net operating income divided by the property's current market value. If a property produces £50,000 in annual NOI and is worth £1,000,000, the cap rate is 5.0%.
That sounds simple, and that's exactly why investors misuse it. The most common bad advice is to chase the highest cap rate you can find, as if one percentage tells you everything about quality, risk, financing pressure, taxes, and long-term value. It doesn't.
Used properly, the rate of capitalization is one of the clearest tools in property investing because it strips out financing and lets you compare assets on operating performance. Used lazily, it hides the very things that decide whether an international deal works in practice.
Understanding the Rate of Capitalization
Cap rate matters because it gives investors a common pricing language across very different property markets. In practice, it shows how much income a property produces before debt and investor-level tax are applied, which makes it useful for comparing a stabilised flat in London with a rental block in Warsaw or a serviced asset in Dubai. The formula is simple. The judgement is not.
What the formula is really measuring
At its core, the rate of capitalization measures unlevered property income against current market pricing. Investors use it to compare assets before financing choices distort the picture. That is why cap rate remains useful in cross-border analysis, where mortgage costs, loan terms, and borrower access to credit differ sharply by country.
This matters more in international investing than many buyers realise. A 7% cap rate in an emerging market can look better than a 4.5% cap rate in a mature city, but that headline gap often reflects weaker tenant quality, thinner buyer demand, higher maintenance volatility, legal uncertainty, or expensive local debt. Cap rate helps frame the comparison. It does not settle it.
What counts in NOI
Most underwriting errors start with NOI.
Net operating income should reflect the property's recurring income after recurring operating costs needed to keep that income coming in. Rent usually sits at the centre, along with normal property-related income such as parking or service income where relevant. Operating expenses typically include management, insurance, repairs, utilities paid by the owner, and routine running costs.
Several items sit outside NOI and should stay outside it:
- Debt service: interest and principal depend on how the buyer funds the deal.
- Investor tax: tax treatment changes by ownership structure and jurisdiction.
- Depreciation: this is an accounting item, not an operating outflow.
- Major capital works: full building upgrades and other large one-off projects are capital items, not normal operations.
Cross-border investors need extra discipline here. In established markets, expense reporting is often more standardised and easier to verify. In emerging markets, sellers may present income on a cash-collected basis, leave out vacancy friction, or understate management and repair costs. Two assets can show similar cap rates and still have very different real income quality.
For a practical primer from an operator's perspective, VerticalRent's cap rate insights pair well with this explanation of rental yields across global property markets.
Why consistency matters more than headline yield
Cap rates only work when the inputs are consistent. If one listing uses actual trailing expenses and another uses seller-friendly projections, the comparison is already weak. The same problem appears when investors compare gross rental yields in one country with true NOI-based cap rates in another.
This is one reason established markets often trade at lower cap rates. Lower yield does not automatically mean worse value. In many cases, buyers are paying for clearer title, deeper financing markets, stronger tenant covenants, better data, and easier exits. Emerging markets can offer higher income yields, but investors should price in local taxes, currency exposure, legal enforcement, and the cost of being wrong.
How to Calculate Capitalization Rate with Examples
A cap rate calculation is simple. The hard part is making the inputs honest enough to compare a London block with a secondary asset in Manila or a retail unit in Warsaw.
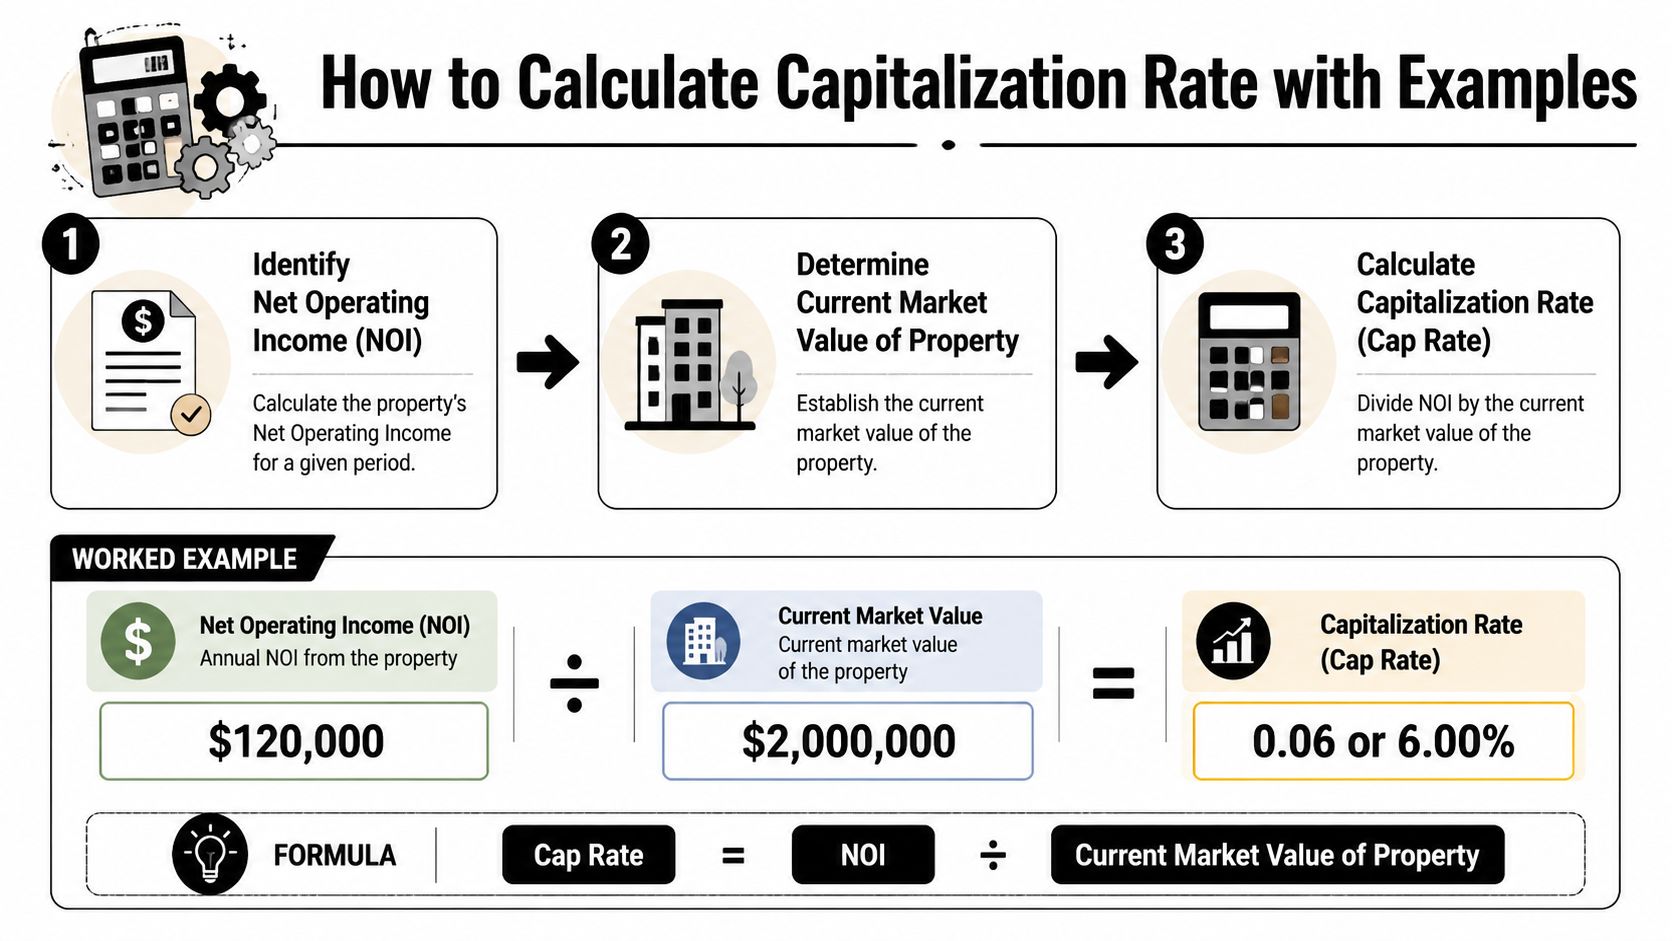
Cap rate = Net Operating Income ÷ Current Market Value
That formula stays the same across markets. The underwriting does not. In established markets, income and expense records are usually cleaner, leasing terms are easier to verify, and valuation evidence is deeper. In emerging markets, the calculation often needs more adjustment for collection risk, informal costs, tax leakage, and periods where quoted rent does not convert neatly into banked income.
A calculation process that holds up under scrutiny
Use this order:
Start with annual gross income
Include contracted rent and other recurring property income tied to operations.Deduct operating expenses
Include management, insurance, routine repairs, owner-paid utilities, maintenance, local property charges, and realistic vacancy allowance where appropriate.Calculate NOI
This is income before debt service, income tax, depreciation, and capital works.Use current market value
Use the asset's present market price or supportable market valuation, not the seller's target number or your future upside case.Divide NOI by market value
Convert the result into a percentage.
If you want a quick way to test rent, costs, and vacancy assumptions before building a full model, this rental yield calculator for property analysis is a useful starting point.
Example 1. Stabilised asset in an established market
Take a UK rental asset generating £80,000 in annual rent. Assume £30,000 in recurring operating costs, including management, insurance, routine repairs, and owner-borne charges. That leaves £50,000 in NOI.
If current market value is £1,000,000, the cap rate is:
£50,000 ÷ £1,000,000 = 5.0%
The calculation is straightforward. The judgment sits in whether the costs are fully loaded and whether the valuation reflects current market pricing rather than a stale appraisal.
Example 2. Similar headline yield, different real risk
Now compare that with an apartment building in an emerging market. On paper, the seller may show the equivalent of £90,000 in annual rent on a £1,200,000 asking price, which suggests a stronger income return. But once you adjust for higher vacancy friction, collection loss, informal maintenance payments, local transfer taxes that affect pricing, and the need for third-party asset management, NOI may fall much more than the headline rent implies.
If adjusted NOI is £60,000, the cap rate is:
£60,000 ÷ £1,200,000 = 5.0%
Same cap rate. Different risk profile. One asset may sit in a deep financing market with cheaper debt and easier resale. The other may require a higher equity buffer, carry FX exposure, or face slower legal enforcement. The formula does not capture those differences. Your underwriting has to.
Using cap rate in reverse for valuation
Cap rate is also a pricing tool.
Value = Net Operating Income ÷ Cap Rate
If a property produces £100,000 in NOI, its implied value at a 5% cap rate is £2,000,000. At a 4% cap rate, the implied value rises to £2,500,000.
This matters in negotiations. A seller asking for a lower cap rate is asking you to accept a higher valuation for the same income stream. That can be reasonable if the asset has stronger tenants, longer lease security, better financing access, lower operating volatility, or a more liquid exit market. Without those supports, the pricing case is weak.
For development-led acquisitions or repositioning deals, cap rate should sit inside a wider appraisal, not replace it. Domus platform for development viability is relevant when you need to test whether income assumptions, build costs, and exit pricing still work together.
Interpreting Cap Rates What Is a Good Rate
A “good” cap rate is not a market average you can copy from another country. It is the rate that pays you enough for the asset, the jurisdiction, the financing terms available to you, and the exit risk you will face.
That matters most in cross-border comparisons. A 4.5% cap rate in a mature market such as London, Singapore, or Munich can be more defensible than a 7.5% cap rate in an emerging city where debt is scarce, taxes are less predictable, lease enforcement is slower, and resale liquidity is thin. On paper, the higher number looks better. In practice, the lower one may leave you with a stronger risk-adjusted outcome.
Why the headline number can mislead
High cap rates usually exist for a reason. Sometimes the reason is opportunity. More often, it is a mix of weaker tenants, shorter lease security, heavier capital expenditure, poorer disclosure, local oversupply, or political and currency risk.
Low cap rates also need context. In established markets, buyers often accept tighter pricing because they are buying easier financing access, better legal enforcement, deeper institutional demand, and a cleaner exit route. Those advantages rarely show up in the formula, but they affect realised returns.
Cap rate is a pricing cue. It only becomes useful after you test what sits behind the income and how hard it will be to finance, hold, and sell the asset.
Established versus emerging markets
Investors make expensive mistakes by comparing cap rates across borders as if each market offers the same debt terms, tax treatment, and operating certainty.
They do not.
In an established market, a lower cap rate can still work because interest margins may be tighter, valuation evidence is usually stronger, and transaction processes are more predictable. In an emerging market, you may need a materially higher cap rate just to cover practical frictions such as transfer taxes, withholding taxes, FX volatility, weak title systems, rent collection risk, or limited refinancing options. If local debt costs 9% and the property is trading at a 7% cap rate, the income story is already under pressure before you account for vacancy or repairs.
The UK benchmark mindset
UK investors also need to judge cap rates against the wider cost base. With the Bank of England's Bank Rate at 4.25% as of May 2026 and UK inflation at 3.5% in April 2026 (funding rates and market conditions discussion), the question is not whether a cap rate looks high or low in isolation. The question is whether the spread is wide enough to absorb financing costs, inflation pressure, operating volatility, and future leasing risk.
That is why the same 5% cap rate can be acceptable in one submarket and too thin in another. If rents have reversion potential, supply is constrained, and tenant demand is stable, the pricing may hold. If service charges are rising, void periods are lengthening, or refinancing is uncertain, the spread disappears quickly.
A practical test for what counts as “good”
Use three filters before calling any cap rate attractive:
- Market depth: Is there reliable leasing evidence, lender appetite, and a visible exit pool, or are you relying on a thin set of comparable deals?
- Income durability: Are current rents supported by market demand and tenant covenant strength, or propped up by incentives, short leases, or one-off occupancy?
- Real return after friction: After local taxes, financing terms, compliance costs, maintenance, and currency risk, does the yield still justify the jurisdiction?
If you also want a quick benchmark for the income side of the equation, this guide to what counts as a good rental yield is a useful cross-check.
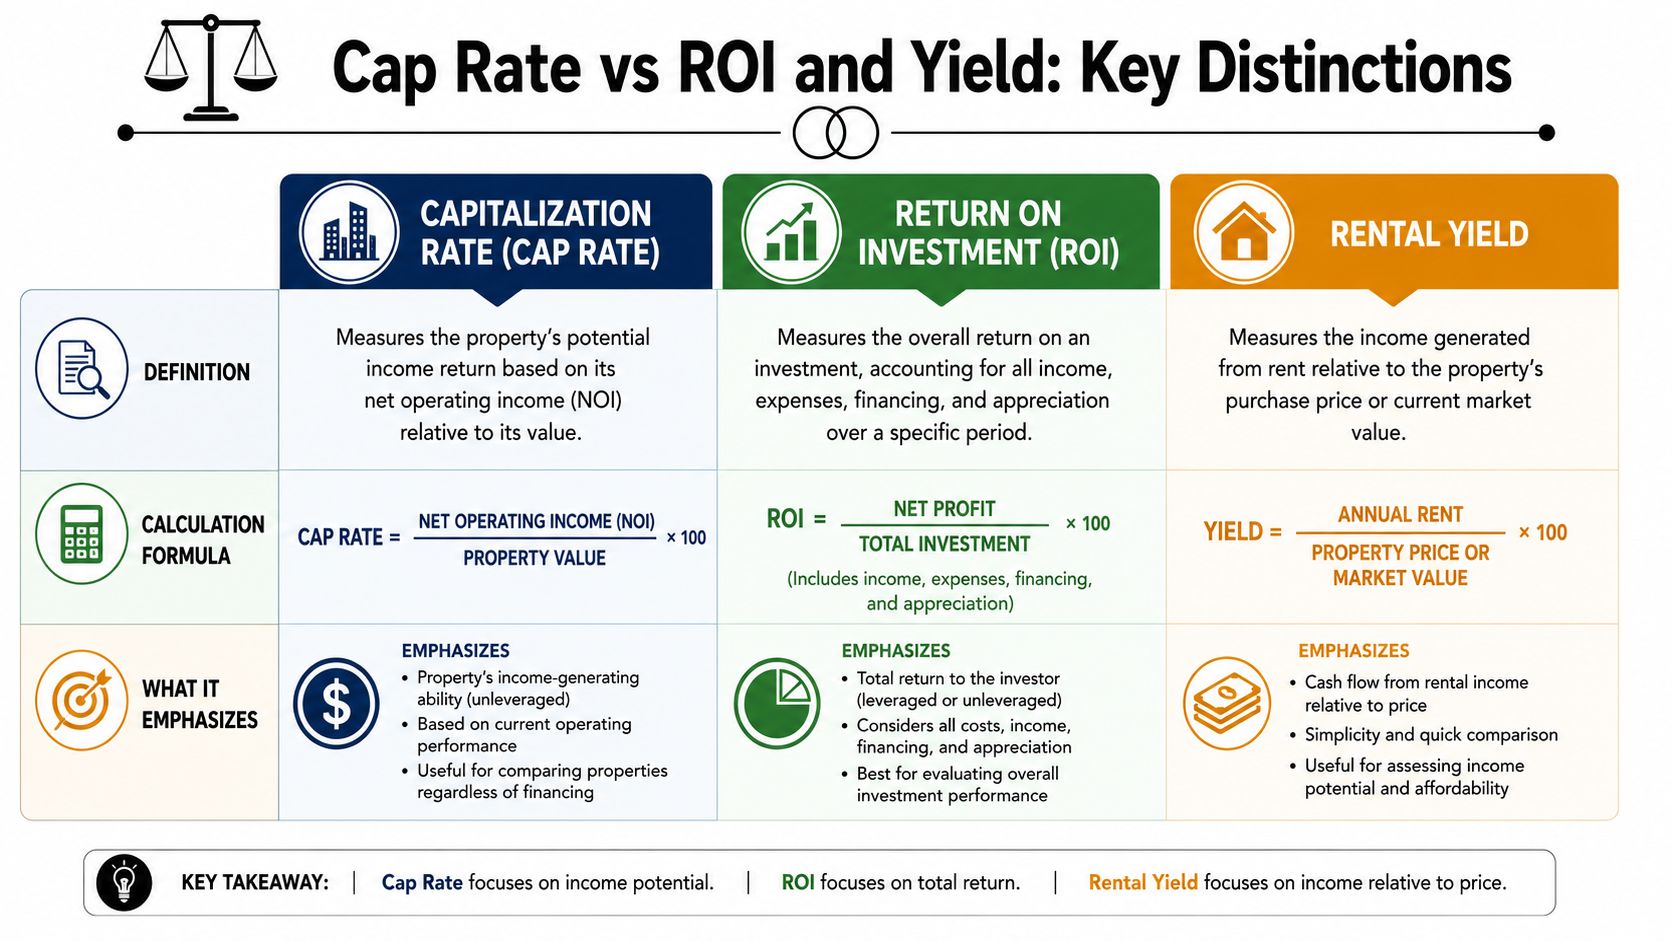
Cap Rate vs ROI and Yield Key Distinctions
These terms get mixed together constantly, and that leads to poor decisions. They are related, but they answer different questions.
The cap rate is NOI divided by current market value, and it acts as a direct proxy for an asset's unlevered annual yield. Because NOI excludes mortgage principal and interest, cap rate isolates operating performance from financing structure, which makes it useful for comparing properties with different debt assumptions, as explained by Corporate Finance Institute's cap rate overview.
Where each metric belongs
| Metric | Best use | What it includes | What it misses |
|---|---|---|---|
| Cap rate | Compare assets | Operating income against market value | Personal financing and tax outcome |
| ROI | Measure your actual investment return | Your equity, debt structure, and realised performance | Clean asset-to-asset comparison |
| Rental yield | Quick screening | Rental income against value or purchase price | Full operating detail unless calculated very carefully |
The practical distinction
Cap rate belongs at the asset comparison stage. It helps you line up a traditional buy-to-let in Manchester, a city apartment in Madrid, and a multifamily block in a secondary US metro on a more standardised basis.
ROI belongs at the investor decision stage. It tells you whether the specific way you finance and own the property delivers the return you need. Two investors can buy the same asset at the same cap rate and end up with very different ROI outcomes.
Rental yield is useful, but it is often quoted too loosely. Some people mean gross yield. Others mean a rough net yield. Unless the calculation method is clear, yield can be directionally helpful but not decision-grade.
Use the right metric for the right job: cap rate to compare the building, ROI to judge your deal, yield to screen quickly.
If you want to map that distinction onto your own numbers, a practical guide on how to calculate return on investment for property helps separate headline asset performance from investor-specific returns.
Applying Cap Rates in Global Property Markets
High cap rates do not automatically mean better value. In cross-border property, they often mean you are being paid to absorb risks that a spreadsheet does not capture.
That is why cap rate works best as a sorting tool, not a verdict. It helps compare markets on a common basis, but the useful comparison is between risk-adjusted income streams, not just headline percentages.
Established versus emerging market logic
Established markets usually trade at lower cap rates because buyers are paying for liquidity, stronger lease enforcement, deeper debt markets, and better operating data. A flat in central London or Paris may look expensive on a cap rate basis, yet the buyer often gets a more predictable exit, better tenant depth, and fewer surprises in title, management, and compliance.
Emerging markets often show higher cap rates for valid reasons. Those reasons include thinner buyer pools, less reliable comparables, weaker property management, more volatile regulation, currency pressure, and slower resale. Higher yield can be attractive, but only if it covers those frictions with room to spare.
Ask a better question: which market offers the better risk-adjusted return once financing terms, taxes, operational drag, and exit risk are fully priced in?
Indicative residential cap rates in key global cities
The table below is directional, not decision-grade. International comparisons only work when rent, vacancy, operating costs, ownership structure, and taxes are normalised first.
| City | Country | Indicative Cap Rate (%) | Market Profile |
|---|---|---|---|
| London | UK | Lower | Established, highly liquid, often priced for stability and long-term demand |
| Paris | France | Lower | Core European market with strong institutional interest |
| Lisbon | Portugal | Mid to lower | Popular international market, but local regulation and operating structure matter |
| Dubai | UAE | Mid to higher | Investor-friendly in some segments, but service charges can alter the true net return |
| Budapest | Hungary | Higher | Emerging European opportunity with potentially stronger yield but more market-specific risk |
| Athens | Greece | Higher | Value-led market where asset quality and local execution matter heavily |
For early screening, country-level comparisons of rental yield by country help identify where pricing and income sit today. They are only a starting point. City submarkets, building quality, and local expense treatment can shift the result materially.
Local conditions can distort the headline cap rate
Two assets can post the same cap rate and carry very different investment outcomes.
In established markets, debt is often cheaper and more available, which can justify accepting a lower cap rate if cash flow remains resilient under local lending terms. In emerging markets, nominal cap rates may look stronger, but higher borrowing costs, lower loan-to-value ratios, or foreign-buyer restrictions can wipe out that advantage at the equity level.
Tax treatment matters just as much. Short-term lets, corporate ownership, withholding taxes, transfer taxes, and local deductions can all change what reaches the investor after expenses. Before comparing countries, review the ownership and tax structure with specialist advice such as Allied Tax real estate tax guidance.
A few examples show where cap rate screens fail:
- Short-term lets: Gross income can look compelling, but turnover costs, platform fees, licensing rules, and occupancy swings often reduce NOI more than first-time buyers expect.
- Apartment towers with heavy service charges: Rent may be strong, yet building fees and sinking-fund contributions can erode net income quickly.
- Emerging city centres: Entry pricing may be attractive, but title issues, weaker enforcement, and a shallow resale market can justify a wider cap rate spread.
What works in international screening
When comparing an established market with an emerging one, I focus on three checks before I trust the cap rate.
First, verify the rent roll. Use signed leases, actual occupancy, and local market evidence, not broker optimism.
Second, rebuild the expense line from the ground up. In many countries, owner costs sit in places foreign buyers miss, including service charges, association fees, compliance upgrades, insurance, and local management intensity.
Third, test the exit. A low cap rate can still work in a deep market with repeat buyers and accessible debt. A high cap rate can disappoint if resale depends on finding one cash buyer willing to accept the same local risks you did.
Beyond the Formula Limitations and Final Checks
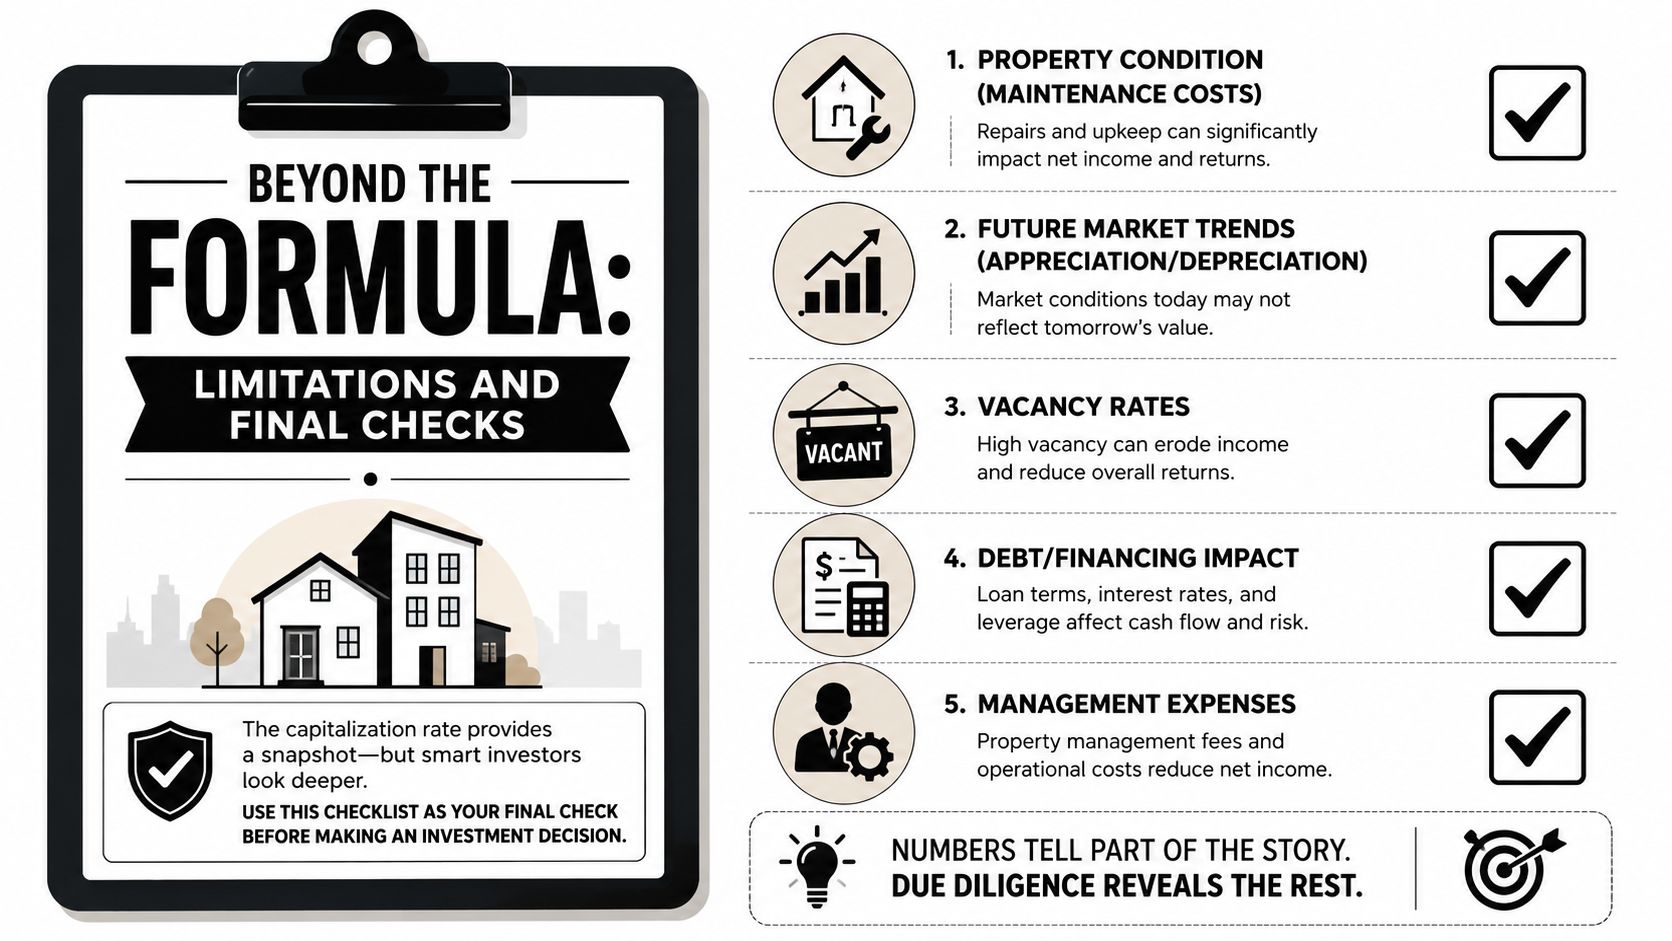
Cap rate is powerful because it is simple. Its weakness is also its simplicity.
It is a snapshot of one year's operating income against today's market value. It doesn't tell you where rents are heading, whether the building needs major work, how your tax structure affects net proceeds, or whether debt terms make the deal fragile.
What the formula leaves out
The biggest omission is capital expenditure. A property can show an acceptable cap rate while carrying near-term costs for lifts, roofs, façades, plant, compliance upgrades, or energy-efficiency work. Those costs may not sit inside a normal NOI calculation, but they will hit your actual returns.
The second omission is financing sensitivity. For advanced underwriting, it matters that cap rate tends to converge toward the cost of debt when debt financing approaches 100% and amortisation becomes very long. That is why prudent investors should test sensitivity to interest-rate changes rather than relying only on the headline yield, as discussed in this piece on how cap rate interacts with debt cost.
The investor-level issues that still matter
Even if the property screens well on cap rate, the deal can still fail for investor-specific reasons:
- Tax structure: Cross-border ownership, withholding, local property taxes, and relief rules can reshape net return.
- Management burden: A distant market with poor operators can destroy an otherwise sound underwriting case.
- Liquidity risk: Some properties are easy to buy and hard to sell.
- Regulatory drift: Short-term letting rules, planning changes, and energy standards can all hit future NOI.
For tax-side thinking, especially where ownership structure and jurisdiction matter, Allied Tax real estate tax guidance is a useful reference point.
If the cap rate looks good but the building needs heavy capital work, the financing is tight, and the local tax treatment is unclear, you don't have a bargain. You have unfinished analysis.
A practical cap rate analysis worksheet
Use this checklist before you approve any deal.
Income quality
- Verify rents: Check whether current rent is contractual, recently achieved, and sustainable.
- Review occupancy: Make sure income isn't flattered by unusual short-term conditions.
- Separate one-offs: Remove irregular income that doesn't belong in recurring NOI.
Operating costs
- Normalise expenses: Include realistic management, maintenance, insurance, and owner-borne charges.
- Check local obligations: Confirm whether council tax, service charges, or compliance costs sit with owner or tenant.
- Stress test net income: Assume costs rise faster than expected and see what happens.
Valuation
- Use current market value: Don't rely on a historic basis when comparing assets.
- Compare like with like: Benchmark only against similar asset types and locations.
- Interrogate the spread: Ask why this property trades at a higher or lower cap rate than peers.
Financing and tax
- Model debt separately: Test interest-rate sensitivity and debt coverage.
- Review tax treatment: Understand local and home-country implications before you commit.
- Check cash flow after debt service: A sound asset can still produce weak investor returns if debt is wrong.
Physical and strategic review
- Inspect CapEx exposure: Identify major repair or upgrade requirements.
- Assess market depth: Consider how easy the asset will be to refinance or sell.
- Match strategy to market: Stable, low-cap-rate markets and higher-yield emerging markets serve different portfolio roles.
A strong property analysis doesn't reject cap rate. It puts cap rate in its proper place. Use it first to compare assets cleanly, then layer in financing, taxes, regulation, physical condition, and exit risk. That is how disciplined investors avoid buying a spreadsheet that doesn't survive actual market conditions.
If you're comparing markets, testing yields, or narrowing down where to invest next, World Property Investor offers country and city guides, rental yield research, and practical international property analysis to help you screen opportunities with more confidence.