New Zealand’s average house price is $909,572 NZD as of March 2026. That headline figure is useful, but it’s also incomplete, because New Zealand is not one property market. It’s a collection of very different local markets with very different risk and return profiles.
That’s the point global investors often miss when they search for average house prices New Zealand. The national average tells you where the market sits. It doesn’t tell you where value sits. In New Zealand, those are not the same thing.
The New Zealand Property Market in 2026
New Zealand remains attractive to international buyers for reasons that go well beyond property. It offers political stability, a transparent legal environment, and strong global recognition as a lifestyle destination. For an investor, though, those soft factors only matter if the pricing makes sense.
The market in 2026 is best understood as a post-correction market, not a distressed one. The national average now sits well below the 2022 peak, but it still reflects a market that remains expensive by long-run domestic standards. That creates a selective environment. Premium locations still carry scarcity value. Secondary locations now deserve closer attention because entry pricing is materially lower.

For investors who are pairing property with migration planning, the rules around residency matter just as much as the asset itself. A useful starting point is this guide to New Zealand permanent residence pathways, because ownership and residency are separate questions.
Why the national average can mislead
A buyer looking only at the national figure could conclude that New Zealand is “expensive”. That’s too blunt. Some districts trade at a deep discount to the national average, while premium locations sit in a completely different pricing band.
Practical rule: Treat the national average as a screening number, not a buying signal.
That distinction matters if you’re allocating capital internationally. A high-net-worth investor buying for capital preservation will assess Auckland or Queenstown-Lakes differently from an investor seeking stronger income resilience in a less fashionable district.
What matters in 2026
Three questions matter more than the headline average:
- Entry price discipline: Can you buy below the national benchmark without stepping into structural weakness?
- Local demand quality: Is demand driven by broad local economic activity, or by a narrow buyer pool?
- Exit liquidity: Will the next buyer profile be local, domestic investor, expatriate, or lifestyle purchaser?
New Zealand still offers opportunity, but only for investors willing to look beneath the headline number.
Understanding the National Price Landscape
Official market benchmarks put New Zealand’s average residential sale price at a level that immediately screens out casual buyers and forces serious investors to think in allocation terms, not headline affordability. For an international buyer, the national figure is useful only as a capital threshold. It does not describe the asset you are likely to buy, the income you should expect, or the resale pool you will face.
That distinction matters because New Zealand’s average price is heavily influenced by expensive urban and lifestyle markets. A waterfront home, a standard suburban house, and a small apartment can all sit inside the same national measure. For underwriting, that makes the average a starting reference rather than a pricing tool.
Average price versus investable reality
The practical question is not whether New Zealand is expensive in aggregate. The practical question is where price density and tenant demand still align.
Global investors should break the market into three separate filters. First, absolute entry cost. Second, price per square metre relative to local incomes and replacement cost. Third, rental yield after allowing for taxes, insurance, maintenance, and vacancy. National averages help with the first filter only. They are weak guides for the second and third, which are the filters that shape actual returns.
Property type matters as much as postcode. Detached housing gives you land exposure and, in tighter supply corridors, stronger long-term scarcity value. Apartments can improve cash flow discipline, but title structure, body corporate rules, and remediation risk can change the return profile quickly. For buyers focused on the capital, understanding property law in Wellington is useful, and many of the same legal principles apply across other urban transactions.
A second implication is portfolio fit. New Zealand tends to reward selectivity more than speed. Investors comparing it with other developed markets should use a broader cross-border benchmark, such as this property market forecast guide for international investors, before assuming the national average alone justifies an allocation.
What the national figure actually helps you assess
Used correctly, the average price still has value:
| Market lens | What the national average helps you assess |
|---|---|
| Capital required | Whether New Zealand fits your acquisition budget and financing plan |
| Regional mispricing | Which districts sit materially above or below the country benchmark |
| Asset selection discipline | Whether a low purchase price reflects value, small dwelling size, weaker liquidity, or soft local demand |
The more useful conclusion is straightforward. An area trading below the national average is not automatically cheap. It may offer smaller homes, lower household incomes, thinner buyer depth, or weaker rent growth.
That is why discerning buyers move quickly from average price to price per square metre, local rental evidence, and transaction liquidity. In New Zealand, the gap between a good nominal price and a good investment can be wide.
Historical Price Trends and Future Forecasts
From the post-crisis low to the 2022 peak, New Zealand house prices rose dramatically. By 2026, that repricing has reversed part of the excess, but only part of it. For investors, the practical point is clear. The national market has corrected, yet entry pricing still demands discipline.
As noted earlier, the long-run series shows three phases that matter. A sharp recovery after 2009. An unusually strong acceleration through the pandemic period. Then a material pullback from the 2022 high into 2026. That sequence matters more than any single headline number because it shows how quickly this market can move when credit conditions, migration, and buyer confidence shift at the same time.

What the cycle means in practice
The key investment takeaway is not solely that prices fell after 2022. It is that the correction has been uneven in its implications.
In premium markets, a pullback can improve entry conditions without changing the structural scarcity story. In lower-growth districts, the same nominal decline may reflect weaker occupier demand, softer local incomes, or thin resale liquidity. A national correction therefore creates two very different investor experiences. One buyer gets a better entry point into a supply-constrained market. Another gets trapped in a cheaper asset with limited rental growth and a narrow exit pool.
That is why future performance is unlikely to be driven by the national average alone. Price path now depends far more on sub-market economics, replacement cost support, and the ability of local rents to justify values.
How to frame the forecast
A sensible forecast for 2026 and beyond starts with restraint. There is no credible basis for assuming a broad, rapid rebound across the whole country. The more realistic base case is a fragmented recovery, where selected districts stabilise first and others lag for longer.
Three filters matter:
- Scarcity-led prime locations: Better suited to capital preservation, but entry pricing leaves little room for underwriting mistakes.
- Regional centres with durable employment and tenant demand: Better aligned with income-led strategies, especially for investors screening best buy-to-let locations for stronger rental fundamentals.
- Low-price districts with weak turnover: Higher apparent value, but often with more exit risk and less pricing power.
This is a market where timing the national cycle matters less than choosing the right local demand base.
For a global investor, the implication is straightforward. Underwrite rent, vacancy risk, and resale depth before assuming the recent correction has created broad value. New Zealand still offers opportunity in 2026, but the better opportunities are likely to come from regional divergence and yield discipline, not from a simple belief that the whole market will return to its prior peak quickly.
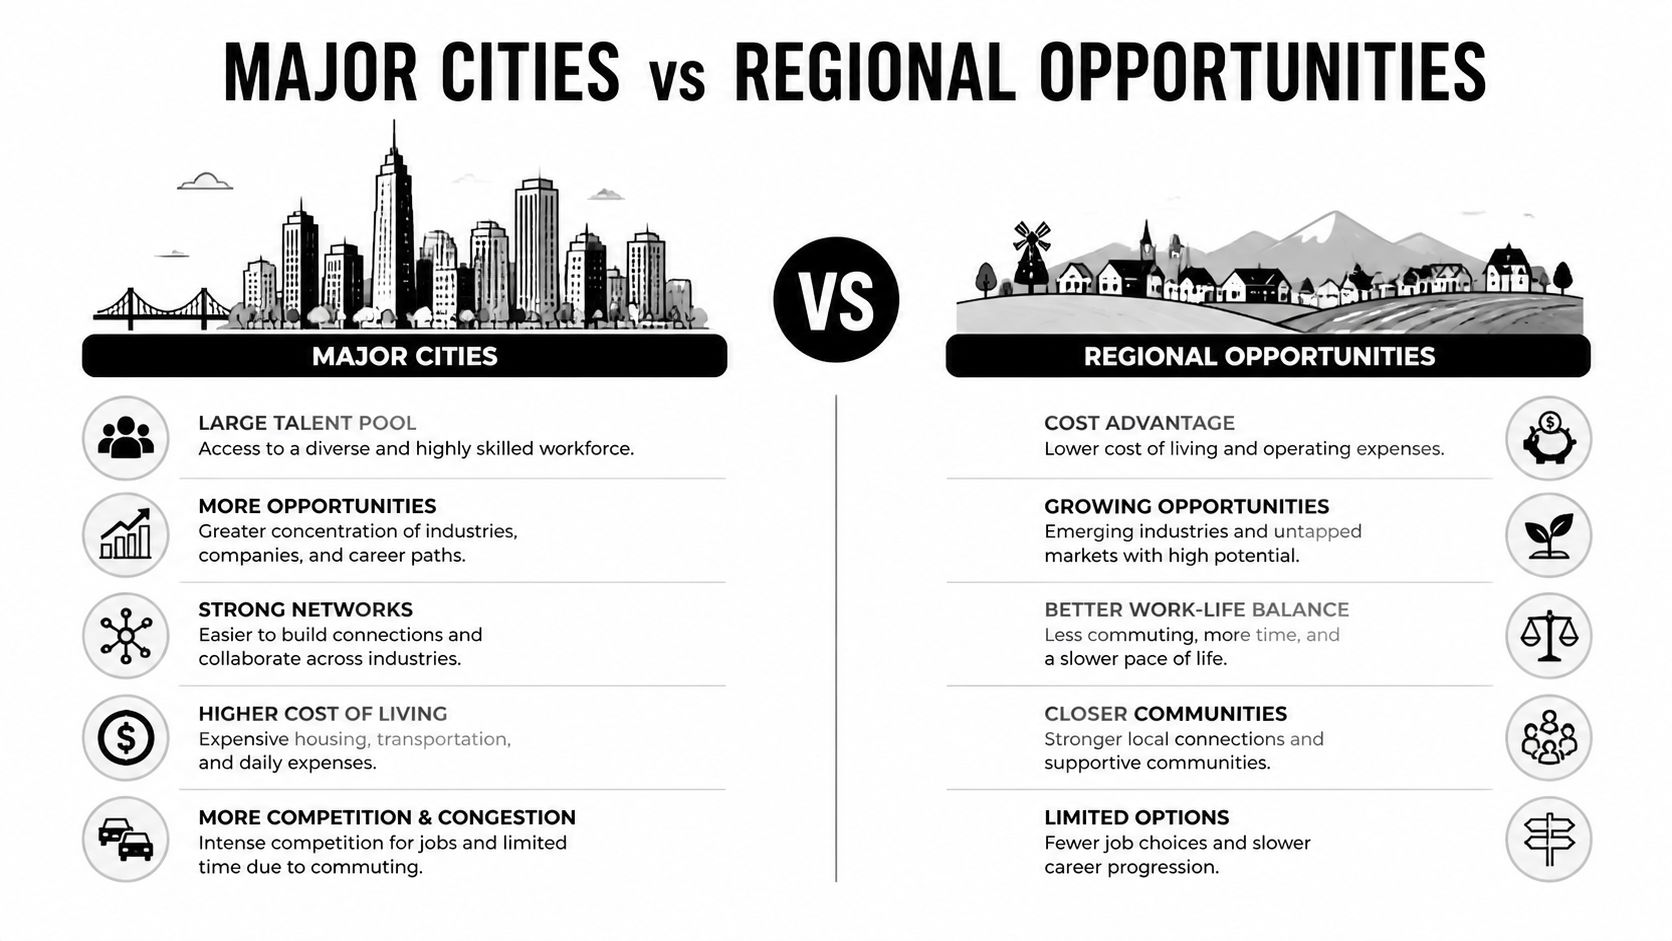
Major Cities vs Regional Opportunities
To properly understand average house prices New Zealand, the following analysis is useful. The national market posted a 0.42% decline over the past 12 months, but Opes Partners’ regional house price data shows how little that national move explains. Wairarapa fell 7.7% year on year, while the Bay of Plenty rose 5.1%.
That’s not noise. It’s a sign that capital is moving according to local conditions, not national averages.
The premium end of the market
At the top of the pricing spectrum, Queenstown-Lakes sits at $1,931,981, and Auckland at $1,196,980 in the same source. These are not interchangeable markets.
Queenstown-Lakes is largely a scarcity and lifestyle proposition. Investors buy into prestige, tourism appeal, and constrained prime stock. That can support values, but it also narrows your future buyer pool and can make pricing more sentiment-sensitive.
Auckland is different. It is the country’s largest urban economy and the most internationally recognisable residential market. For many overseas investors, it’s the default gateway. The problem with default markets is that everyone sees them first, so obvious value is harder to find.
The overlooked middle and lower end
The same source identifies Ruapehu at $354,916, Waitomo at $381,535, and Buller at $386,391 as the cheapest districts. That group sits at a 61% discount to the national average.
That discount is large enough to attract attention, but not large enough on its own to justify investment. A low entry price can improve gross yield potential. It can also hide weaker tenant demand, thinner liquidity, and slower resale.
A more interesting regional signal is Hawke’s Bay, where the source notes a median of $700,000 and 5.7% year-on-year growth. For an investor, that suggests a region that is neither bargain-basement nor prestige-priced. Those middle markets often deserve more work because they can offer a better balance between affordability and demand depth.
Matching market type to investor profile
Use a simple allocation logic:
- Capital preservation bias: Focus on Auckland and other established centres where demand is broad and resale is easier.
- Lifestyle plus long hold: Premium markets such as Queenstown-Lakes can fit, provided you accept pricing risk and a narrower buyer base.
- Income-first strategy: Lower-priced districts may offer stronger yield maths, but only if local employment, population stability, and tenant demand are real.
- Balanced growth and income: Mid-tier regions deserve serious attention because they’re often ignored by offshore capital.
For investors comparing regional buy-to-let ideas across countries, this broader list of best buy-to-let locations for international investors is a useful benchmark.
Regional discounts are only attractive when they come with durable occupier demand.
The practical takeaway is simple. In New Zealand, regional pricing gaps are wide enough that your location choice will drive returns more than your national market view.
Unlocking Value with Price Per Square Metre and Yields
Absolute house prices are useful for headlines and almost useless for international comparison. A global investor buying in New Zealand, London, Dubai, or Lisbon needs a common unit of value. That unit is price per square metre.
The most useful verified comparison comes from Wise’s New Zealand housing price analysis. It shows an Auckland city-centre apartment at $9,865 NZD per square metre and a Christchurch city-centre apartment at $4,979 NZD per square metre. Christchurch is therefore available at a 49% discount on this measure.
Why price per square metre matters more than headline price
Two apartments can cost very different amounts in total and still represent similar value if one is much larger. Price per square metre strips out that distortion.
For international investors, it also answers a more strategic question. How much usable urban residential space does each unit of capital buy?
Auckland’s figure tells you that central-city exposure comes at a premium. Christchurch’s figure tells you that entry into an urban apartment market can be materially cheaper. That doesn’t automatically make Christchurch the better investment, but it changes the hurdle that future rental income needs to clear.
A practical way to think about yield
Gross rental yield is simple in concept:
Annual rent divided by purchase price
That’s the first screen, not the full answer. It ignores operating costs, vacancy, management, insurance, maintenance, tax, and financing. Still, it’s the fastest way to compare opportunities across locations.
If one market offers much lower purchase pricing per square metre, your capital may buy more lettable space. That can improve the income case, especially when tenant demand is steady.
City price and yield comparison
Because verified rental figures are not provided here, the yield column below is qualitative rather than numerical.
| City | Average House Price (NZD) | Apartment PSM (City Centre, NZD) | Est. Gross Rental Yield |
|---|---|---|---|
| Auckland | $1,196,980 | $9,865 | Likely tighter unless rents are exceptionally strong |
| Christchurch | Not verified in the available data | $4,979 | Potentially stronger on purchase-price efficiency |
| National average | $909,572 | Not verified in the available data | Varies widely by sub-market |
A good next step is to run location-specific scenarios with a rental yield calculator for overseas property investors.
How professionals use this metric
They don’t use price per square metre in isolation. They pair it with three questions:
- What tenant profile rents this asset? Student, professional, family, tourist, or mixed.
- How replaceable is the stock? Scarce product behaves differently from commoditised product.
- Does lower pricing reflect inefficiency or a structural discount? Some discounts persist for good reasons.
That’s the shift from homebuyer thinking to investor thinking. The objective isn’t to buy the cheapest property. It’s to buy the best-priced cash-flow stream relative to local demand quality.
Key Drivers Influencing the NZ Property Market
The New Zealand property market doesn’t move on sentiment alone. A handful of underlying forces shape pricing, rents, and buyer behaviour. If you’re investing from overseas, these drivers matter more than short-term commentary.
Borrowing costs and demand
Interest rates shape affordability and investor appetite quickly. When financing becomes cheaper, more buyers can support higher prices. When borrowing costs rise, buyers recalculate and some step back.
New Zealand’s recent cycle makes that relationship clear in broad terms. Loose financial conditions helped drive the earlier surge in values. Tighter conditions contributed to the cooling phase that followed. Even without adding fresh numerical claims here, the investment implication is straightforward. This market is sensitive to the cost of money.
Migration, supply, and local demand
Migration can strengthen both owner-occupier demand and rental demand. Supply constraints can then turn that demand into price pressure, particularly in cities and regions where new stock is hard to deliver quickly.
Construction costs, planning constraints, and infrastructure limits matter because they affect replacement cost and future supply. In some locations, those frictions can support prices. In others, they can reduce development viability without creating strong end-user demand.
When supply is constrained but demand is shallow, prices don’t necessarily rise. You need both sides of the equation.
Rules for overseas investors
For foreign buyers, regulation is not a side issue. It is part of the investment case.
New Zealand has restrictions on overseas ownership of residential property, and the practical outcome is that many non-residents cannot buy freely in the same way domestic buyers can. There are exemptions and specific pathways, but you should not assume access until specialist legal and tax advice confirms it.
Tax also needs care. Rental income, ownership structure, deductibility, and resale treatment all affect net return. New Zealand’s framework has its own logic and timelines, and those rules can change. A disciplined investor treats tax and ownership eligibility as pre-acquisition questions, not post-offer admin.
What actually drives investment outcomes
In practical terms, focus on five filters:
- Financing environment: Can local buyers still absorb current pricing?
- Population and tenant demand: Is demand broad, recurring, and economically rooted?
- Supply response: Can new stock arrive quickly and cap upside?
- Foreign ownership rules: Are you legally able to buy the asset you want?
- Tax treatment: Does the post-tax return still work?
Investors who get these basics right usually avoid the expensive mistakes. Investors who skip them often buy a property before they’ve bought a coherent strategy.
Actionable Takeaways for the Global Property Investor
New Zealand is not a market for lazy capital. It can work well, but only if you match the sub-market to your objective.
If your priority is capital preservation and liquidity, established urban markets are the safer starting point. You’ll usually accept a higher entry price in exchange for deeper demand and a clearer resale path.
If your priority is income and value, lower-priced districts and selected regional centres deserve investigation. But don’t confuse cheap entry with strong yield. You still need tenant depth, local employment resilience, and realistic exit options.
A disciplined decision checklist
Before committing capital, work through this list:
- Check eligibility first: Confirm whether you can legally purchase the target asset as a non-resident.
- Underwrite locally: Review price per square metre, not just headline asking price.
- Test the rent case: Estimate gross yield, then stress-test it against costs and vacancy.
- Assess liquidity: Ask who your next buyer is likely to be.
- Review legal structure: Title, body corporate terms, and local due diligence can alter the economics materially.
- Watch policy risk: Rules affecting foreign ownership, tenancy, or tax can change the investment case quickly.
When New Zealand makes sense
New Zealand fits investors who want a transparent, mature market and are comfortable with moderate pace, regional divergence, and careful stock selection. It is less suitable for buyers looking for simple nationwide momentum or easy foreign access without legal complexity.
The right go or no-go decision usually comes down to one question. Are you buying a market story, or are you buying a location with a clear income and exit case? In New Zealand, the second approach is the one that tends to hold up.
For readers comparing multiple countries before making a move, this guide to buy-to-let abroad is a sensible next step.
If you’re comparing New Zealand with other international markets, World Property Investor publishes country and city guides that help you assess prices, yields, taxes, foreign ownership rules, and market risk before you commit capital.