You're probably looking at a shortlist right now. One city looks safe but expensive. Another looks cheap and fast-growing. A third keeps appearing on social media as an “undervalued” hotspot. The hard part isn't finding opinions. It's deciding which signals matter, which ones are noise, and what any of it means for your money.
That's where real estate market analysis stops being theory and becomes a discipline. Good investors don't just ask whether a place is popular. They ask whether tenant demand is durable, financing is workable, regulation is manageable, and the exit is realistic. A market can look strong on headlines and still be a poor investment once debt levels, liquidity, and policy risk are factored in.
The biggest mistake new investors make is treating all markets as if they reward the same style of analysis. They don't. A mature market such as the UK usually demands precision around affordability, regulation, and marginal pricing power. An emerging market often requires far more attention on legal certainty, infrastructure, currency exposure, and whether growth is real or just speculative marketing.
What Is Real Estate Market Analysis?
Real estate market analysis is the process of testing whether a property sits in a market that can support your return assumptions without exposing you to avoidable risk.
That sounds simple, but it changes how you buy. One investor hears that an area is “up and coming”, sees a refurbished flat, and buys because other people seem enthusiastic. Another investor checks transaction-backed pricing, rental demand, finance costs, local supply, and likely resale depth. Both may buy in the same postcode. Only one knows what could go wrong before committing capital.
A useful way to think about it is this. A good area is not always a good investment. Nice cafés, new branding, and local buzz don't automatically produce sustainable rent, resilient values, or a clean exit.
For a practical primer, the Saleswise real estate analysis guide is a useful companion because it frames analysis as a decision tool rather than a pile of disconnected metrics. If you're starting from scratch, a basic grounding in real estate investing for beginners also helps before you start comparing countries and cities.
What analysis is really trying to answer
Most investors only need four answers:
- Income strength. Can this asset produce rent that's realistic, repeatable, and resilient?
- Capital preservation. If the market softens, how exposed are you to forced selling or weak buyer demand?
- Financing fit. Does the debt structure still work if rates stay higher or refinancing becomes harder?
- Exit quality. When you sell, who is the next buyer and what will matter to them?
Practical rule: Analysis is less about predicting the future perfectly and more about avoiding deals that only work in one favourable scenario.
The difference between research and conviction
Reading articles isn't analysis. Analysis starts when you compare variables and test whether they agree with each other.
If prices are rising but sales activity is thin, you shouldn't assume momentum is strong. If gross yield looks attractive but regulation is tightening, your real return may be weaker than the headline suggests. If a location has strong tenant demand but poor lending access, owner-occupier exit demand may still disappoint.
That's why serious real estate market analysis acts as a bridge between a listing and an investment thesis. It gives you a reason to proceed, renegotiate, or walk away. Walking away is often the most profitable decision.
Decoding the Core Indicators of Market Health
A market can look attractive for exactly the wrong reason. I see this often when an investor compares a flat but liquid market such as the UK with a faster-rising emerging market. One shows modest price growth and steady turnover. The other shows stronger headline gains, but thinner transaction data, looser lending standards, or a narrower buyer base. The right question is not which market looks stronger on paper. It is which signals are dependable enough to protect your capital and support your exit.
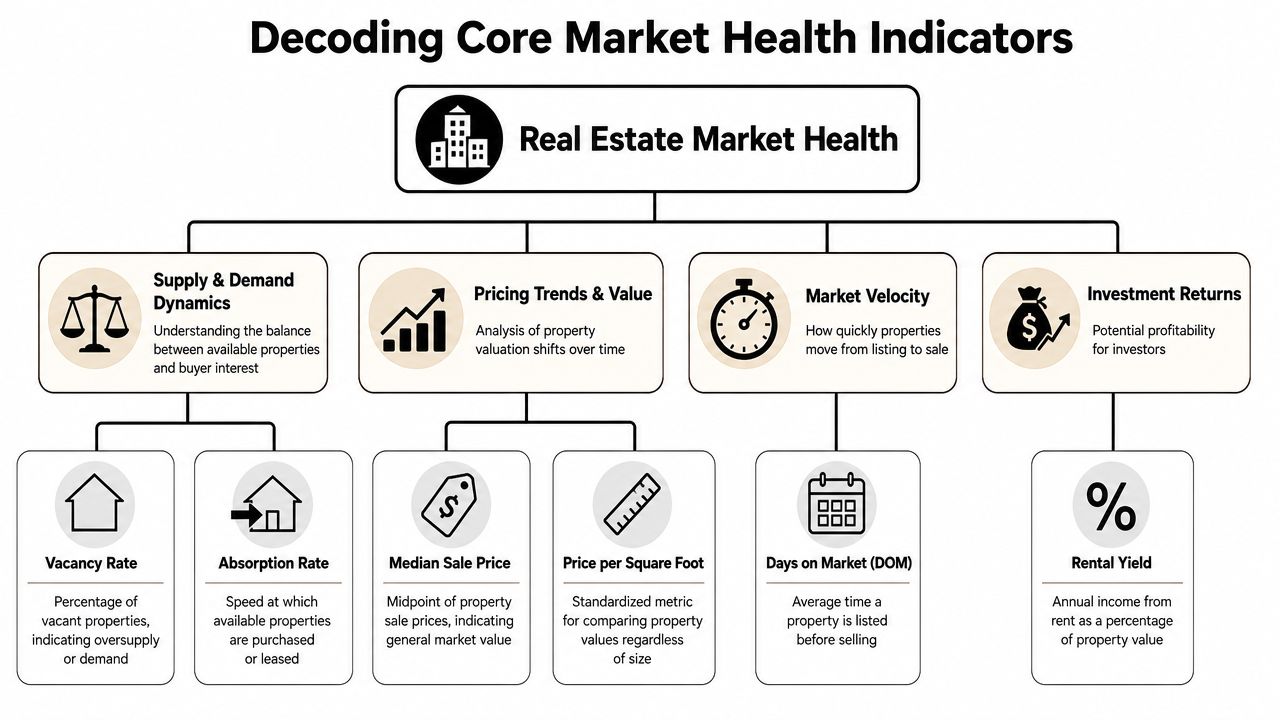
Price and sales trends
Price gets attention because it is easy to quote. It is less useful on its own.
In the UK, analysts usually start with completed-sale data rather than asking prices because it gives a cleaner read on what buyers paid. Even then, national averages are only a first screen. They can hide a city with improving liquidity, or a weak local market where prices have not yet adjusted but transaction activity already has.
The practical test is simple. Pair price movement with sales volume and time on market.
- Sales volume shows whether buyers are still committing capital.
- Days on market shows how much friction sits between listing and completion.
- Price direction shows where values are moving, but not how durable that move is.
If prices are edging up while transaction volume stays soft, I do not treat that as proof of strength. In a mature market, it can mean sellers are slow to reset expectations. In an emerging market, it can mean a small number of speculative deals are distorting the headline.
Rental yield and vacancy discipline
Yield screens deals. It does not validate them.
Gross yield is useful for triage. Net yield is what determines whether the asset still works after maintenance, management, tax, regulation, arrears, and financing costs. That gap matters more in markets where compliance is tightening or operating costs are less predictable.
For income property, investors should understand the difference between headline yield, net operating income, and valuation-based return measures. A practical refresher on analyzing rental property investment with cap rate sits well alongside a more property-focused explanation of the rate of capitalization for real estate investors.
A lower gross yield in a stable, liquid market can be the better investment if cash collection is consistent and resale demand is deep. A higher gross yield in an emerging market may compensate for legal uncertainty, weak tenant enforcement, currency risk, or a thinner buyer pool. The number only matters once you know what risk you are being paid for.
Vacancy should be read the same way. In a transparent market, vacancy data can tell you whether landlords are losing pricing power. In a less transparent market, advertised vacancy may understate shadow supply, informal renting, or unfinished stock likely to compete with you later.
Supply and demand dynamics
Many weak investments still have visible demand. The problem is incoming supply.
A reliable reading tracks inventory, sales volume, and days on market together. Rising stock with flat or falling transactions usually points to weaker absorption. Falling stock with steady demand usually supports pricing. For an investor, that affects two things immediately. How hard you may need to negotiate today, and how easy it may be to refinance or sell later.
Use the pattern, not any single figure:
| Indicator pattern | What it often means for investors |
|---|---|
| Prices up, volume up | Demand may be broad-based, but affordability still needs testing |
| Prices up, volume weak | Price gains may be thin and easier to reverse |
| Stock rising, sales flat | Buyers usually gain negotiating power |
| Stock tight, demand stable | Sellers and landlords often have more pricing power |
Mature and emerging markets necessitate different weighting. In the UK, small changes in inventory, mortgage approvals, or time on market can be meaningful because the market is deep and data quality is usually better. In a higher-growth emerging market, I put more weight on whether the demand is owner-occupier led or speculation led, whether new supply will complete, and whether transaction data captures the market at all.
Good analysis is not about collecting more indicators. It is about deciding which indicators deserve the most trust in the market you are buying into, and what they mean for your money and your downside if conditions turn.
Analysing the Economic and Financial Drivers
Property investors eventually learn the same lesson. The building matters, but the financing environment and the broader economy often decide the result.
Economic health on the ground
A local market with diverse employment, dependable wages, and real occupier demand usually gives you more room for error. A market that depends on one sector, one employer, or one tourism cycle can perform well for a time, then turn sharply when conditions change.
In practice, I want to know who supports housing demand. Is it owner-occupiers with stable incomes? Students? Short-let visitors? Expat renters? Public sector workers? The answer affects volatility, void risk, and your exit route.
That's also why “growth” needs context. In a mature market, slow and broad-based demand can be healthier than sharp price movement in a narrow segment.
The financing environment
In the UK, mortgage rates are one of the main demand-side variables because even small changes in borrowing costs affect buyer affordability and bid capacity, a point highlighted in Felt's overview of real estate market research. Analysts typically compare local price trends with financing costs to judge whether sales are responding to rates or to something more localised.
The UK market also changed structurally after the financial crisis. In 2014, the Bank of England's Financial Policy Committee recommended that lenders test whether borrowers could still afford repayments if rates rose by 3 percentage points, and it also advised that most new mortgages should be capped at 4.5 times gross income, as summarised in this review of the shift in housing analysis. Since then, affordability has become central to market analysis, not a side note.
That has a direct investment implication. If local buyers can't borrow enough, your resale pool shrinks even if the area looks desirable.
For investors building their own forecasts, it helps to think in scenarios rather than straight lines. A technical introduction such as DataTeams on time series prediction can be useful if you want to model how rates, prices, and transaction activity move over time. It also pairs well with a practical market outlook such as this property market forecast for 2025.
Government and regulatory influence
Tax policy, tenancy rules, planning restrictions, and foreign ownership rules can reshape returns without any dramatic change in headline prices.
Established markets usually have deeper legal systems but more procedural friction. Emerging markets may offer higher upside, but investors need to verify title quality, enforcement, planning certainty, and whether promised infrastructure is funded.
The wrong regulation can damage a property's economics faster than a soft quarter in prices.
Good real estate market analysis always asks a blunt question. If the rules tighten, does this deal still work?
How to Source Data and Structure Your Analysis
A spreadsheet filled with property data can still produce a bad decision.
I see this often with newer investors comparing a market like Manchester with a fast-growing city in Southeast Asia or Eastern Europe. They collect listings, skim a few broker reports, and treat every number as equally reliable. That is how investors overpay in opaque markets and miss risk in stable ones. The job is not to gather more data. The job is to rank the evidence, separate tradable facts from sales talk, and organise it around return, downside, and exit.
A practical workflow starts with source hierarchy. Official data should anchor your view of completed transactions, inflation, rates, employment, and population trends. Commercial portals are useful for live asking prices, rental listings, and visible supply. Local brokers, valuers, and property managers come last, not because they lack value, but because their insight is strongest when you use it to test published numbers rather than replace them.

Build a source hierarchy
Use three layers.
- Official bodies. In the UK, that usually means the ONS, HM Land Registry, Gov.uk publications, and Bank of England material. In another market, look for the closest equivalent of a statistics office, land registry, planning authority, or central bank.
- Market platforms. Property portals help you track current asking rents, current stock, listing reductions, and neighbourhood competition.
- Local operators. Estate agents, letting agents, developers, valuers, and mortgage brokers help you check whether the visible market is clearing at those levels.
This matters more in emerging markets. In the UK, official records are usually slow but dependable. In a higher-growth market, official data may be thin, delayed, or inconsistent across agencies, so portal data and operator interviews carry more weight. That does not mean lowering your standards. It means being more explicit about what is confirmed, what is inferred, and what still needs verification.
Keep listed data and completed data separate. Asking rent is not achieved rent. Listing volume is not closed sales volume. A market with rising inventory and weaker transactions usually gives buyers more negotiating room. A market with tight stock and stable deal flow usually supports pricing better. One metric on its own rarely answers the investor's real question, which is whether income and resale assumptions are conservative enough.
Organise the numbers before you interpret them
A simple sheet works if it forces discipline. The structure matters more than the software.
I'd organise it in four layers:
- Market layer. Country, city, neighbourhood, asset type, and legal ownership position.
- Demand layer. Sales activity, tenant profile, rent direction, wage support, and local employment drivers.
- Supply layer. Current stock, future pipeline, time on market, incentives, and competing listings.
- Deal layer. Purchase costs, expected rent, void allowance, maintenance, taxes, financing assumptions, and realistic exit assumptions.
That layout helps you compare unlike markets without pretending they behave the same way. In a mature market, the deal layer often decides whether a purchase still works after financing and tax. In an emerging market, the market and supply layers may deserve more attention first, because title certainty, delivery risk, and oversupply can damage returns long before yield looks attractive on paper.
If you want a quick way to standardise income assumptions across markets, use a rental yield calculator for comparing gross and net returns.
The short video below gives a useful visual sense of how investors turn raw property data into a workable decision process.
Keep your analysis focused on investor questions
Research becomes expensive noise when it does not change a decision.
Every note, tab, and broker call should help answer a small set of questions:
- Can I rent it at the level I'm assuming?
- Can I finance it safely?
- If conditions weaken, how exposed am I?
- Who will buy this from me later?
I would add one more when comparing market types. Which mistake is more likely here? In the UK, the common error is overpaying for stability and accepting weak cash flow. In an emerging market, the common error is underwriting growth too confidently and underpricing legal, currency, or exit risk.
If a data point does not change your view on income, risk, liquidity, or price discipline, give it less weight. That is how analysis stays useful, especially when one market offers safety and another offers speed.
A Step-by-Step Framework for Market Analysis
Good investors move from broad risk to specific deal risk. They don't begin with the flat. They begin with the country, then the city, then the neighbourhood, then the asset.
Start top-down with country and city selection
At the highest level, you're deciding whether a market is investable at all. That means looking at legal reliability, financing conditions, policy direction, taxation, and economic depth.
A stable country with slower growth may still beat a faster market if capital can be deployed and recovered with less friction. This oversight is common among many cross-border investors. They chase nominal growth without asking whether they can enforce a contract, repatriate funds smoothly, or refinance on sensible terms.
Once the country passes, narrow to the city. Look for real demand drivers, not slogans. Transport, universities, medical centres, logistics hubs, and broad employment bases often matter more than branding.
Move to neighbourhood analysis
Neighbourhood selection is where macro confidence gets tested against street-level reality.
Check transport links, school catchments, employment access, tenant mix, and competing stock. In established markets, small differences in micro-location often decide whether a property rents quickly and whether resale demand stays broad. In emerging markets, neighbourhood work matters even more because city averages can be misleading and data can be patchy.
A useful discipline is to compare what local agents say with what listings show and what completed evidence suggests. When those three disagree sharply, caution is usually warranted.
Working rule: If you can't explain who the end user is, why they choose that area, and what alternatives they have, you haven't finished the neighbourhood analysis.
Finish with bottom-up deal analysis
Optimism has to meet arithmetic.
Stress test your rent. Stress test your costs. Stress test your debt. Don't just ask whether the deal works today. Ask whether it still works if refinancing is less friendly or if your exit takes longer than planned.
That point is particularly relevant in the UK. A strong analysis now includes mortgage affordability stress-testing at purchase, not just headline price direction. Recent UK data noted that average house prices rose 5.4% year on year to £271,000 in the 12 months to March 2026, while the Bank of England kept the Bank Rate at 4.25% in May 2026, raising the practical question of what happens to cash flow and exit flexibility if the investor must refinance within 24 months at a less favourable rate, as discussed in this article on finding undervalued properties. That's the kind of debt-aware thinking many investors skip.
I'd run three versions of every deal:
- Base case with realistic rent and costs
- Weak case with softer rent or longer vacancy
- Exit case with slower resale and tighter lending
If the investment only works in the base case, it's usually too fragile.
Adapting Your Analysis for Different Market Types
Two markets can both look attractive on a spreadsheet and still demand very different decisions.
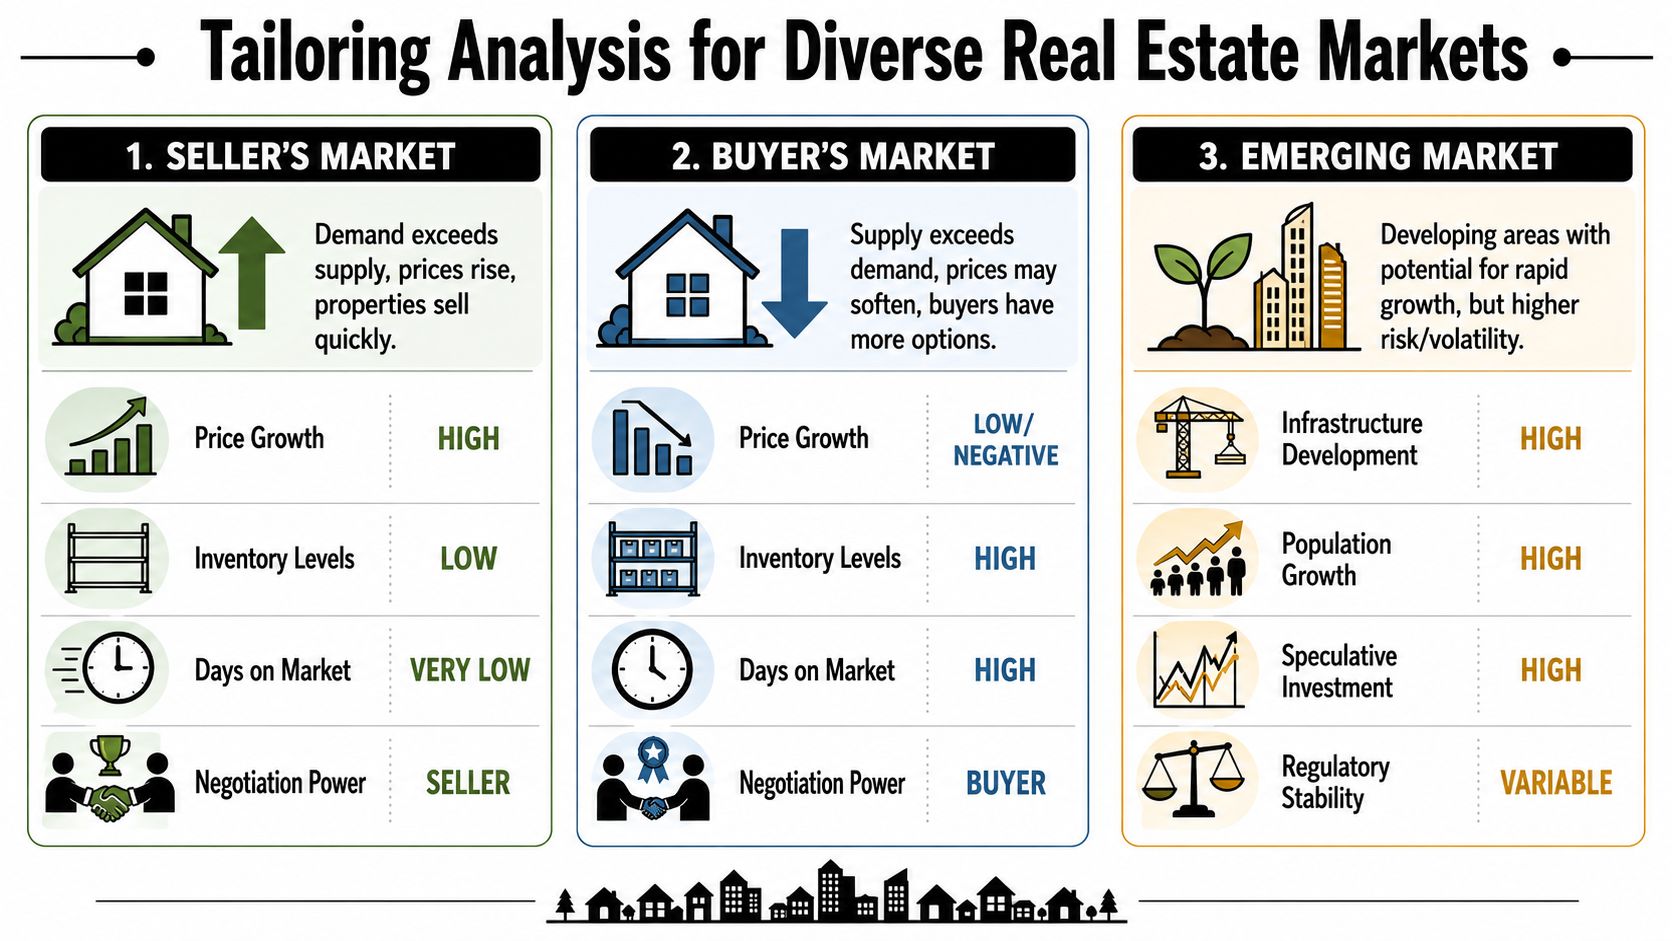
A flat in Manchester and an apartment in a fast-growing secondary city in an emerging economy may both offer a similar headline yield. That does not mean they carry the same risk, the same path to exit, or the same margin for error. Good analysis adjusts its priorities to the market in front of you.
Established markets
In mature markets such as the UK, Germany, or parts of France, the advantage usually comes from precision. Prices are more widely observed, legal systems are clearer, and large mispricings are less common. Investors tend to make money by buying the right asset at the right basis, not by betting on dramatic market expansion.
That changes what deserves the most attention. National averages matter less than local affordability, transport links, tenant depth, and resale liquidity. In the UK, for example, broad house price headlines often hide very different conditions between regions, cities, and even neighbouring postcodes. As noted earlier, that is why national data should only be the starting point.
In these markets, I'd put more weight on:
- Affordability and lending conditions, because borrowing costs can do more damage to returns than modest price growth can repair
- Regulation and tax treatment, because mature markets often have tighter compliance, tenancy, and energy-efficiency rules
- Depth of resale demand, because your exit usually depends on a broad pool of ordinary buyers, not one special buyer
- Micro-location differences, because a few streets can separate resilient demand from weak demand
- Net yield rather than gross yield, because mature markets often carry more visible operating and compliance costs
If you are comparing countries, it helps to review a wider range of emerging property market opportunities alongside established ones. That keeps you from applying UK-style assumptions to a market with very different rules, data quality, and buyer behaviour.
Emerging markets
Emerging markets require a different mindset. The upside is often easier to see than the fragility underneath it.
You may find lower entry prices, stronger population growth, new infrastructure, and a more obvious development story. Those can be real advantages. But the first questions are usually not about squeezing an extra half-point of yield. They are about whether ownership is secure, contracts are enforceable, planning rules are applied consistently, and demand is supported by local incomes rather than speculation.
Currency risk also moves much higher up the list. If rents are collected in a weaker local currency while your capital base, debt, or future spending is tied to pounds or dollars, a market that looks strong in local terms can disappoint badly in your home currency. I have seen investors get the growth call right and still earn poor real returns because they ignored currency and transfer risk.
A simple comparison makes the shift clear:
| Priority | Established market | Emerging market |
|---|---|---|
| Main concern | Margin of safety on price and debt | Legal certainty, policy stability, and execution risk |
| Return focus | Durable income and a credible exit | Growth potential after adjusting for volatility |
| Data challenge | Abundant data, uneven commentary quality | Limited reliable data and patchy market transparency |
| Common mistake | Paying too much for perceived safety | Treating legal, political, and currency risk as background noise |
The practical difference is straightforward. In an established market, a mediocre purchase price can ruin a safe-looking deal. In an emerging market, weak legal protection or poor market plumbing can ruin a cheap-looking deal.
That is the adjustment. Real estate market analysis is not just a search for the best numbers. It is a process for deciding which risks you are being paid to accept, and which ones can permanently damage capital.
Your Final Investment Decision Checklist
A deal should only survive if you can answer a short list of uncomfortable questions without hand-waving.
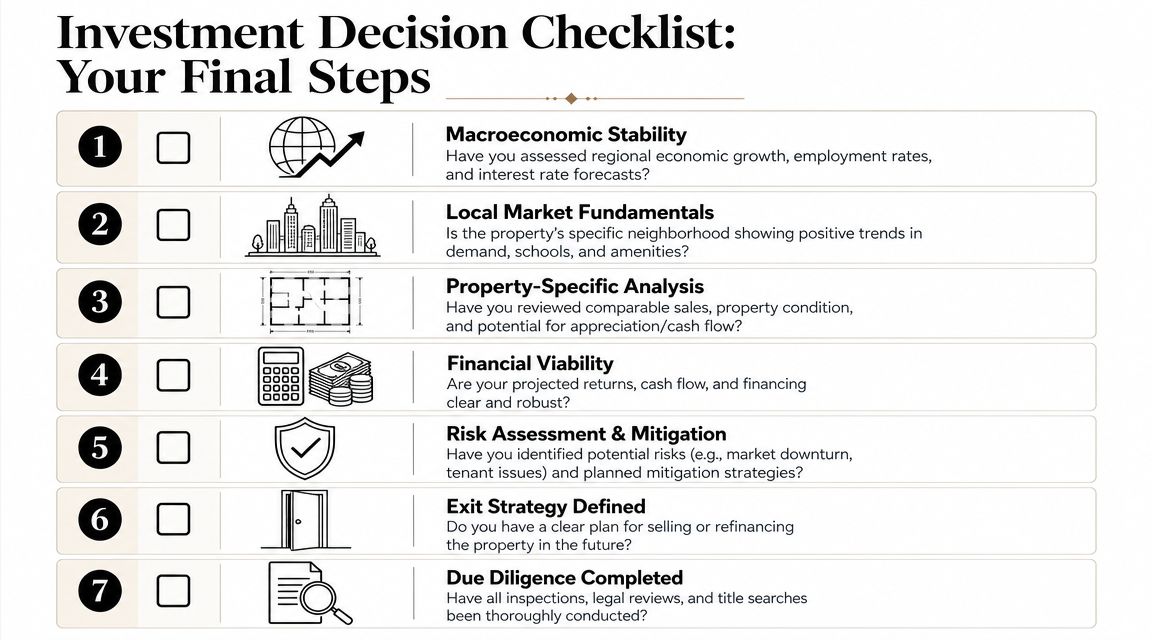
Before you buy, confirm these points:
- Demand is proven. You've validated likely tenant demand and checked that local resale demand isn't dependent on one narrow buyer group.
- Yield assumptions are realistic. You've moved beyond gross figures and tested net income after management, compliance, maintenance, voids, and tax friction.
- Finance is stress-tested. You know what happens if rates stay high, lenders tighten, or a refinance takes longer than expected.
- Market signals agree. Price, stock, transaction activity, and time to sell or let broadly tell the same story.
- Regulatory exposure is clear. You understand tenancy rules, tax treatment, planning restrictions, and any foreign ownership constraints.
- Exit is credible. You know who the likely future buyer is and why they would want this asset.
- You can explain the thesis clearly. If you can't describe the investment in a few plain sentences, you probably don't understand it well enough.
The final test is blunt. If this deal underperforms, will it fail because the market changed, or because you ignored a risk that was visible before purchase? Good analysis won't remove uncertainty. It will stop you from paying for avoidable mistakes.
World Property Investor helps international buyers compare markets, rental yields, pricing patterns, and investment conditions across countries and cities. If you're narrowing a shortlist and want a clearer basis for choosing where to buy next, explore World Property Investor for market guides, country comparisons, and practical research tools.