
The clearest evidence of the UK property market slump came in 2023, when average UK house prices fell 1.4% in the year to December, to approximately £285,000, according to the UK House Price Index summary for December 2023. Yet calling the current market a straightforward collapse would be misleading. By March 2026, average prices were unchanged year on year, and by July they were 1.4% higher, according to official data from the Office for National Statistics and the UK Government.
The more useful diagnosis is a transaction-and-affordability shock. Higher borrowing costs have reduced what buyers can pay, while weaker activity has made the market less liquid. National averages conceal sharper differences between London, southern England, the North, Wales, Scotland and Northern Ireland, as well as between cash buyers, mortgaged landlords, owner-occupiers and commercial investors.
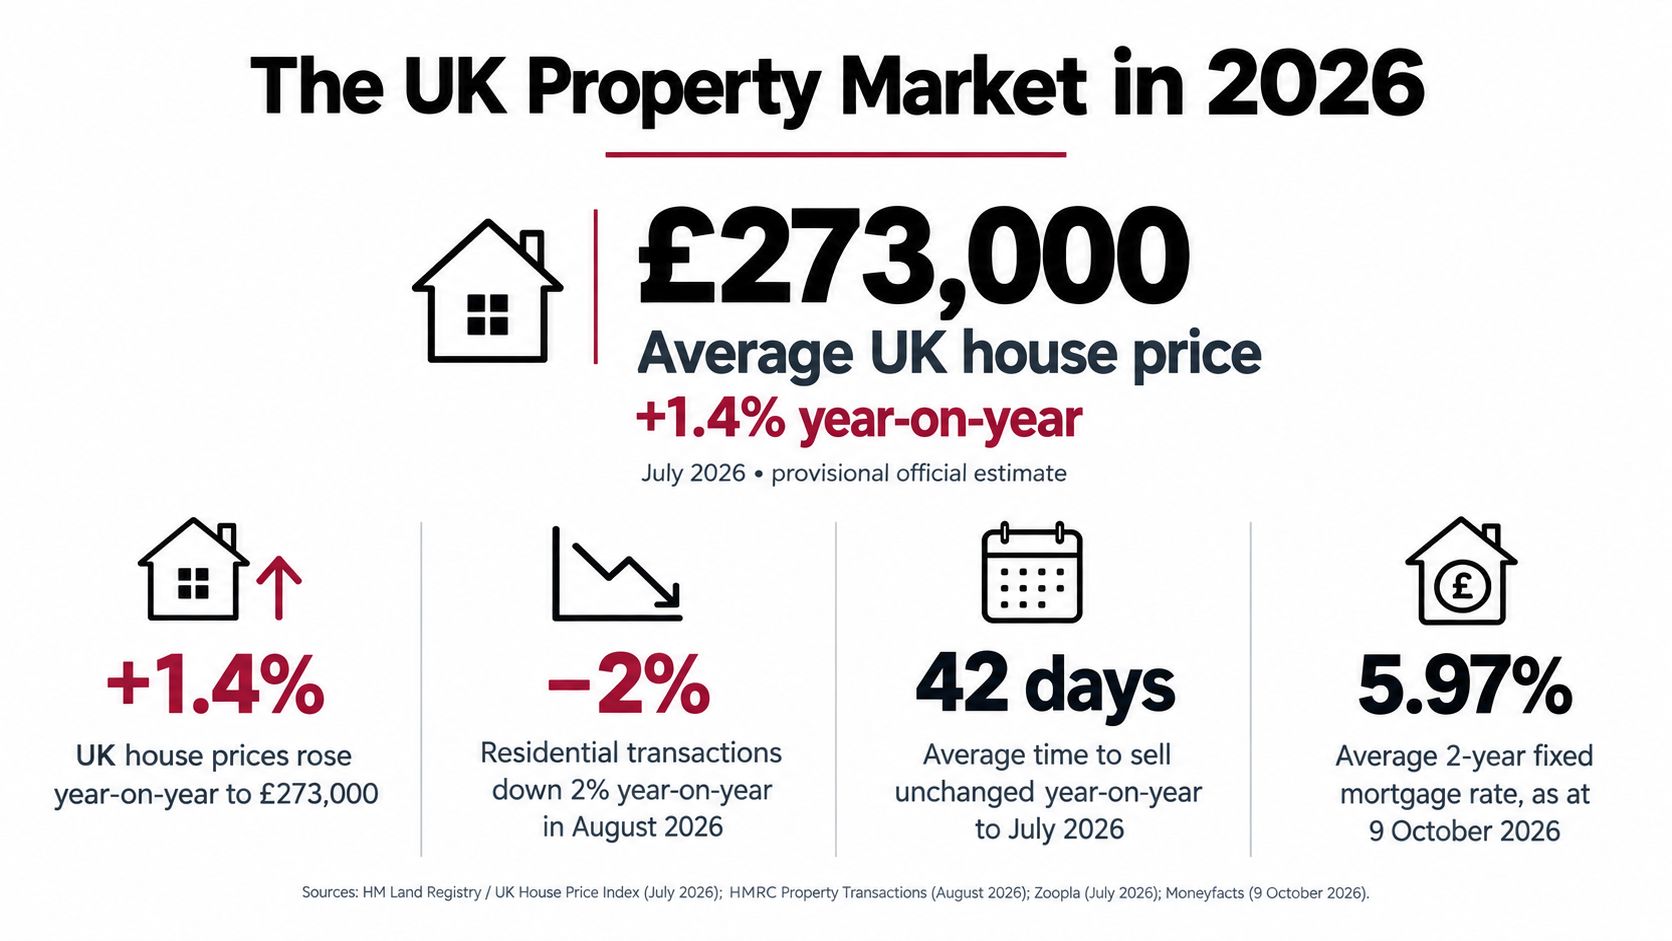
Table of Contents
- What the UK Property Market Slump Means in 2026
- How Mortgage Costs and Productivity Shocks Feed the Slump
- Regional Performance and Where the Weakness Sits
- What the Slump Means for Different Investor Types
- Strategic Responses for the Current Market
- An Underwriting Checklist for the Slump
- Outlook for the Next 12 Months
- Investor Questions on the UK Slump Answered
What the UK Property Market Slump Means in 2026
From rapid growth to stagnation
The market shifted from 13.8% annual house-price inflation in July 2022 to a 2.1% year-on-year fall by November 2023, the largest annual decrease since 2011, according to the December 2023 House Price Index. Transactions contracted alongside prices, falling 29.3% in England, 13.7% in Scotland and 29.2% in Wales in the year to October 2023. Northern Ireland recorded a 13.4% fall in the year to the fourth quarter of 2023.
The combination is more revealing than either measure alone. A price reduction can reflect negotiation between an active buyer and seller. A price reduction paired with fewer completed sales indicates that affordability, confidence or financing has removed participants from the market.
Later figures point to stagnation rather than a single national collapse. The ONS reported an average UK price of £268,000 in March 2026, unchanged from a year earlier. England fell 0.6% and London 2.1%, while Wales rose 2.9% and Scotland 1.6%. By July 2026, the official UK average had reached £273,000. England recorded 1.1% annual growth, Wales 2.6%, Scotland 2.3% and the North East 4.9%, according to UK Government data.
Those averages conceal the investment decision. London and southern markets can remain constrained by expensive borrowing and weaker affordability while northern and devolved markets show firmer price growth. Tenure and buyer type add another divide: a cash purchaser may face limited competition, whereas a landlord with borrowed funds must absorb higher financing costs before assessing returns.
The questions investors should ask
“UK property market slump” describes weak activity, but it is too broad to serve as an investment thesis. Buyers should test four points:
- Where is the weakness? Check the region, postcode and property type rather than relying on the national average.
- Who is under pressure? A highly indebted landlord has different constraints from a cash buyer or owner-occupier.
- What has traded? Completed sales may reflect transactions agreed earlier and may not represent current demand.
- How liquid is the exit? A stable headline price does not ensure a quick sale or acceptable refinancing.
The UK property market trends analysis highlights the divergence between London and stronger regional markets. That comparison should prompt investors to test local rents, achieved prices, financing terms and buyer depth, rather than treat national commentary as a valuation model.
How Mortgage Costs and Productivity Shocks Feed the Slump
Mortgage costs transmit economic pressure into property through affordability, liquidity and the composition of completed sales. Productivity adds a fourth channel: where output and employment growth are weaker, fewer households can absorb higher borrowing costs or sustain price expectations. The result is a transaction and affordability shock, not a uniform national collapse.
Affordability moves before prices
Recent market reporting recorded a five-year fixed mortgage rate at approximately 6%. The Bank of England's June 2026 money and credit data showed the effective rate on newly drawn mortgages rising to 4.35%, from 4.22% in May. The rate on the outstanding mortgage stock increased from 3.92% to 3.96%.
For a repayment borrower, a higher rate raises monthly debt service without increasing rental income or salary. Lenders then reduce the maximum loan available under income and debt-service constraints. Buyers lower bids, delay purchases or leave the market. The effect is strongest where prices require large loans, while cash buyers face less financing pressure.
Landlords face the same arithmetic. If mortgage costs rise faster than rent, gross rent can remain stable while net cash flow deteriorates. A property that passed an interest-coverage test under cheaper finance may fail when the lender applies a higher stressed rate.
Practical rule: Underwrite the property as a financed asset first, not as a price chart with rent attached.
Productivity determines how long demand can withstand that pressure. Regions with stronger employment creation and income growth can support new borrowing and rents more effectively. Regions with weaker productivity growth have less capacity to replace withdrawn mortgage demand. This helps explain why a national average can hide sharply different outcomes across London, the South, the North and the devolved markets.
Liquidity weakens before the index fully reacts
The 2023 transaction data show how quickly activity can contract when affordability deteriorates. In England, completed transactions fell 29.3% in the year to October 2023, according to the official House Price Index summary. Sellers may resist cutting asking prices, but fewer buyers can meet them. The market then clears through longer marketing periods, renegotiation and withdrawn listings.
That creates a distinction between nominal value and liquidity value. A property may retain a similar quoted price while becoming harder to sell, refinance or use as collateral. For an overseas investor, currency movements, remote management and legal costs can make a slow exit more expensive. The practical consequences of weak liquidity are discussed in negative cash flow analysis.
The index arrives late
The UK House Price Index is based on completed transactions. Those transactions typically arrive six to eight weeks after agreement, so the index can lag turning points, as explained in the June 2026 UK House Price Index summary.
When marginal buyers withdraw, completed sales may contain a larger share of less-distressed or more expensive properties. The average price can therefore look resilient while the active buyer pool has thinned.
Read the index alongside approvals, transaction volumes, time on market and achieved-price-to-asking-price ratios. The Bank of England recorded 58,200 net mortgage approvals for house purchase in June 2026, below the approximately 61,400 average over the previous six months. That gap does not prove another price fall, but it shows that financing demand had not fully translated into completed purchases.
Regional Performance and Where the Weakness Sits
The UK property market is not moving as one unit. Regional affordability, employment, tenant demand and resale liquidity produce very different outcomes for owners and buyers.
The latest price picture
The July 2026 regional HPI data show a sharp split. The North East recorded the strongest English annual growth at 4.9%, compared with 1.1% across England. Wales recorded 2.6% growth and Scotland 2.3%.
London sits at the weaker end of the market. Prices were down 2.1% year on year in March 2026, the weakest result among the major markets in the ONS release, while England overall fell 0.6% at that point. High-value markets carry greater exposure to mortgage affordability because a change in borrowing costs affects a larger loan balance.
Transaction activity adds a second layer to the comparison:
| Region | Recent annual price change | 2023 transaction-volume change |
|---|---|---|
| England | 1.1% in July 2026 | -29.3% to October 2023 |
| Wales | 2.6% in July 2026 | -29.2% to October 2023 |
| Scotland | 2.3% in July 2026 | -13.7% to October 2023 |
| Northern Ireland | Not included in the July comparison | -13.4% to Q4 2023 |
| North East | 4.9% in July 2026 | Included within England |
These figures should not be treated as an investment-return league table. They combine different periods and measures. Price growth indicates valuation direction, while transaction volume indicates market activity and the ease of finding a buyer. A region can maintain prices while offering limited liquidity.
A regional shortlist needs more than growth
For an overseas buyer, London provides deep professional demand and international recognition. It also carries higher entry costs and greater sensitivity to financing conditions. The North East has recorded stronger recent price growth, yet local employment, tenant demand, maintenance costs and resale depth still require close examination.
Wales and Scotland need separate analysis rather than automatic comparison with England. Stronger recent official price performance does not guarantee higher rental returns or faster exits. Devolved housing policies and local market conditions can affect both landlord costs and buyer demand.
A falling national average can hide a stagnant expensive market, while a growing regional average can hide a thin resale market.
Investors should compare locations on affordability, rent durability, transaction depth and the quality of the likely exit buyer. The UK buy-to-let cities guide provides a framework for that comparison, but postcode-level evidence should determine the purchase.
What the Slump Means for Different Investor Types
The market's effects depend more on funding, tenure and exit demand than on the national average. A cash buyer may gain negotiating power, while a landlord can face a financing shortfall even when the property's price changes little.

Mortgaged buy-to-let landlords
Landlords face the greatest pressure where mortgage costs, tax, compliance and maintenance absorb most rental income. Hamptons reported that investors bought only 10.9% of properties sold across Great Britain in 2025, the lowest full-year share on record, in its December 2025 lettings index.
The decline has two readings. Well-funded investors may find sellers more willing to negotiate, while debt-funded landlords may be reassessing whether the rental margin justifies the financing and regulatory burden. Lower investor participation does not automatically point to falling rents. It can also reduce future private rental supply, particularly in areas where new construction is limited.
Cash buyers and income-focused owners
Cash buyers avoid immediate mortgage-rate exposure and can offer sellers certainty. That advantage does not remove opportunity cost, weak local tenant demand or the risk of a thin resale market. Their strongest opportunities are assets with durable income and several credible exit buyers, rather than properties discounted solely because the wider market is unsettled.
Commercial and prime-market investors need the same separation by asset type. Schroders reported that MSCI UK All Property capital values rose 1.3% year on year in December 2025, while office values fell 2.3% and industrial and residential values performed better, as reported in the ONS FOI material on UK housing-market conditions. Those figures do not make every commercial segment attractive. A property recovery cannot repair a poorly located office with weak occupational demand.
Investors should distinguish offices from logistics, prime assets from secondary stock, and long leases from income exposed to vacancy. International buyers must also separate currency effects from property fundamentals. A favourable exchange rate can reduce the sterling purchase cost, but it cannot fix weak rental coverage or a difficult exit.
Affordable housing may provide more defensive occupancy characteristics, yet delivery figures do not prove that private rental shortages have been solved. England delivered 32,243 affordable homes in the year to March 2026, including 9,381 social-rent homes, while total completions rose 9% and social-rent completions rose 65%, according to the official affordable housing delivery statistics.
Investors comparing alternatives to conventional residential property can explore UK storage revenue drivers, including differences in income durability and operating complexity.
Strategic Responses for the Current Market
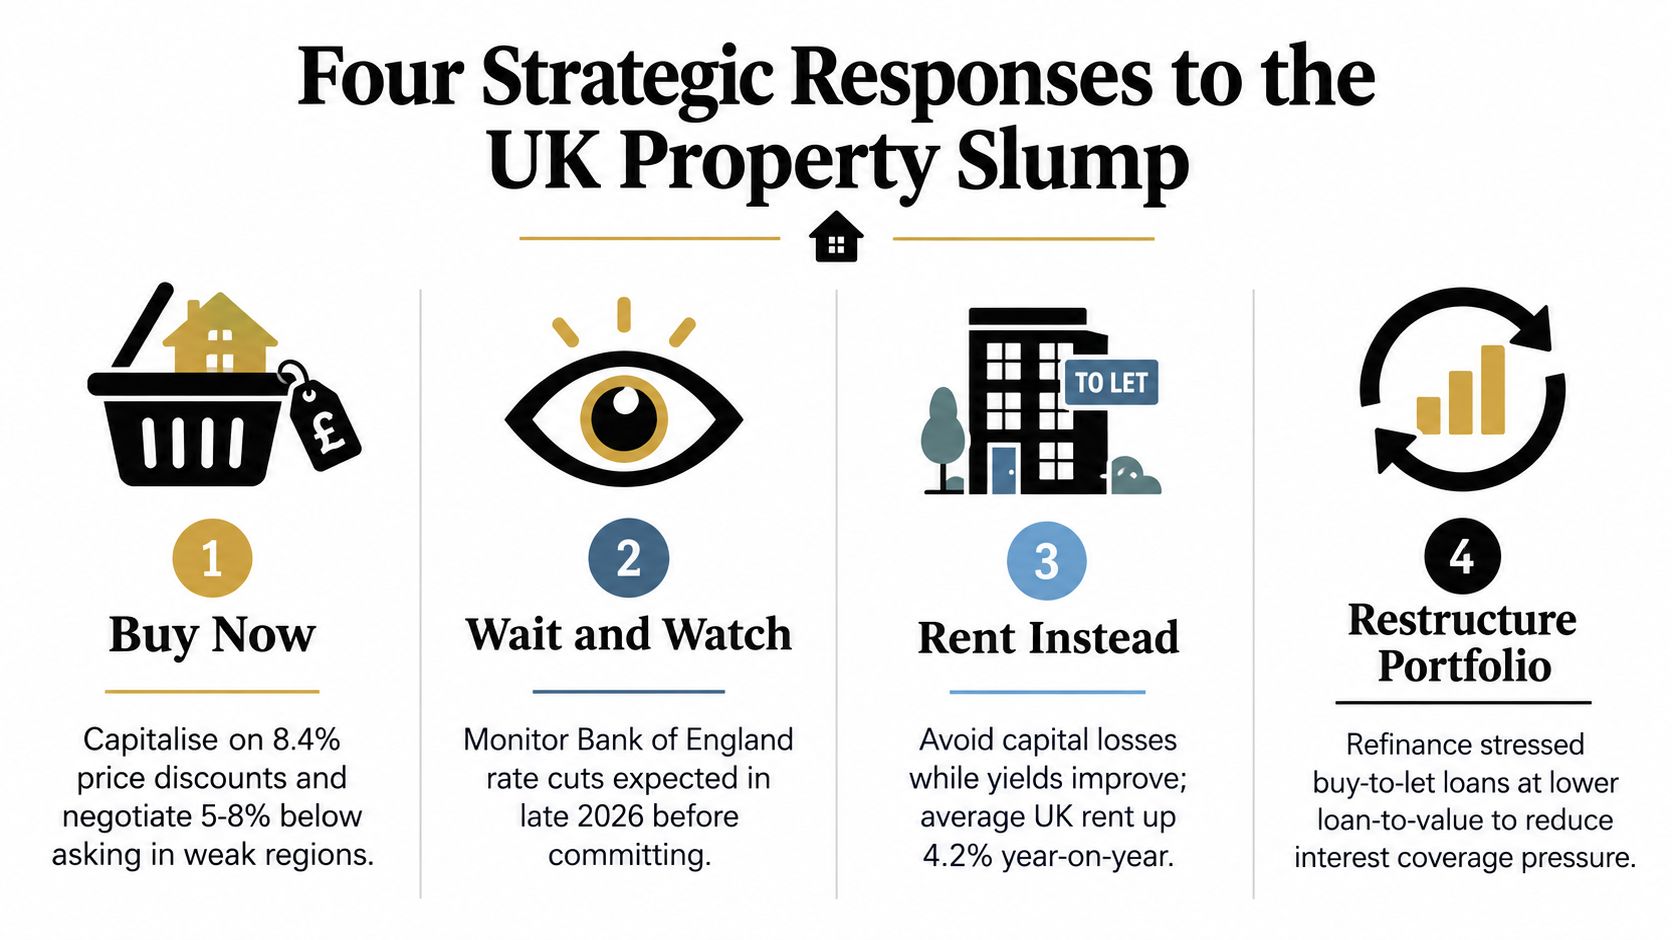
There isn't one correct response to the UK property market slump. The appropriate choice depends on debt levels, liquidity, time horizon, intended use and the investor's tolerance for an uncertain exit.
Buy now
Buying now can make sense where the asset has strong tenant demand, the seller is negotiable and the financing remains viable under conservative assumptions. The case is strongest for a cash buyer or a buyer with substantial reserves who can hold through a slow exit.
The risk is confusing a discount with value. A lower purchase price doesn't compensate for weak rent, major capex or an expensive refinancing date. The trigger to reassess is a deterioration in achieved rents, local employment or financing coverage, not another headline price movement.
Wait and watch
Waiting suits buyers who think rates, approvals or regional activity may improve but don't yet have a compelling property-specific opportunity. Monitoring mortgage approvals and completed transactions can reveal whether demand is broadening or whether headline prices are reflecting a delayed sample.
The cost is opportunity loss. A good asset may sell before the market becomes clearer, and waiting doesn't guarantee cheaper finance or lower prices. Set a defined entry condition, such as acceptable debt service, a verified local rent and a seller willing to transact at a price supported by comparable completed sales.
Rent instead
Renting rather than buying is rational for a prospective overseas resident who values flexibility, wants to test a location or can't yet justify the combined cost of ownership and finance. It reduces exposure to purchase costs and an uncertain exit while the buyer gathers local information.
It doesn't remove housing-market risk. Rent can change, and the tenant has no participation in future price recovery. This option works best when flexibility has real value, not when the buyer is just postponing a decision without tracking suitable properties.
Restructure the portfolio
Existing investors may gain more from restructuring than from a new acquisition. Options include selling a low-coverage asset, cutting debt levels, extending maturities where possible or reallocating from weak offices to more durable income streams.
The right trigger is portfolio-level stress. Review refinancing dates, interest coverage, void assumptions and capital expenditure together. A portfolio that looks acceptable in aggregate may contain one asset consuming cash and masking the performance of the rest.
Use a structured property market research toolkit before committing to any of these routes. The decision should rest on evidence that can be updated, not on a single forecast.
An Underwriting Checklist for the Slump
A UK property deal should survive a stress test before it reaches a viewing. The checklist below focuses on residential acquisitions, while the same principles apply to commercial property with changes for lease length, vacancy and capital expenditure.

Six tests before exchange
Stress-test the purchase price. Model debt at 6%, rather than relying only on the latest newly drawn mortgage rate of 4.35%. Check whether coverage remains acceptable after the higher interest cost. The June BoE data already cited supports treating financing as a variable that can change the outcome, not a fixed assumption.
Set a rental-income floor. Calculate gross and net yield separately. Deduct management, insurance, repairs, compliance, service charges, tax and finance costs before deciding whether rent supports the price.
Allow for voids. Use local letting evidence instead of assuming continuous occupancy. Tenant turnover, refurbishment and licensing delays can turn strong headline rent into weak annual cash flow.
Hold liquid reserves. Reserves should cover mortgage payments, urgent repairs and the time required to sell or refinance. Cash buyers also need funds for unexpected works and delayed completion.
Check the local market. Compare the postcode with regional and national data, then verify completed transactions, current listings, time on market and achieved prices. A detailed property inspection checklist can help identify physical issues affecting value and letting prospects.
Complete legal and technical due diligence. Confirm title, planning, lease terms, building condition, insurance and defects that could restrict mortgageability or resale. For commercial property, examine tenant covenant strength, break clauses and repairing obligations.
Commercial valuation needs a separate warning
A small expansion in the required yield can reduce the capital value of an asset whose worth depends on long-duration rental income. The effect is more severe when lease expiry, vacancy, capital expenditure and refinancing arrive close together.
Model those variables jointly rather than applying an all-property assumption. An office with a high passing rent may be less valuable than one offering a secure income stream with a credible occupier. Review the durability of that income, the cost of re-letting and the likely funding terms at renewal. This distinction matters because commercial weakness can remain concentrated in particular uses even when broader property averages appear stable.
Outlook for the Next 12 Months
The next year is more likely to produce a subdued and uneven market than a nationwide collapse. A stabilising national average can conceal continued weakness in London and parts of England, while Wales, Scotland and the North East follow different paths. Regional divergence, rather than the headline average, should guide forecasts.
The June BoE money and credit data provide a useful test of demand. Approvals sustained above 62,000 for two consecutive months would suggest that affordability and confidence are broadening. A renewed slide below 55,000, especially alongside falling completed transactions, would point to a second leg down. The 4.35% new mortgage rate recorded in June also matters less as a single reading than as a test of whether buyers can secure finance without weakening coverage.
Transaction volumes will show whether demand reaches completion. Regional price prints should be read against that activity, with particular attention to the gap between London and the North East, Wales and Scotland. A price recovery without more completed sales would be fragile.
The Hamptons December 2025 lettings index recorded a 10.9% share for investors across Great Britain in 2025. The forward question is whether investor participation supports rental supply or remains constrained by financing costs. Falling investor activity could tighten future supply even if rents hold locally.
For investors, the practical test is asset-specific: can this property, in this region and on conservative financing, withstand slow transactions while meeting its investment objective? That answer matters more than the label “slump.”
Investor Questions on the UK Slump Answered
Is now a good time to buy?
It can be, but only when the property works without relying on rapid price growth. Cash buyers and investors with lower borrowing may have more negotiating power, while highly geared buyers should demand stronger coverage and reserves.
Are rents about to fall?
The available evidence doesn't justify assuming that. Lower investor purchases may restrict future rental supply, but rent outcomes remain local and depend on tenant demand, affordability and new housing delivery.
Is London a bargain?
London was the weakest major market in the March 2026 ONS figures, with prices down 2.1% year on year, but weakness isn't proof of value. A buyer still needs to test affordability, rent coverage, local demand and exit liquidity rather than treating a lower price as an automatic discount.
How should investors model mortgages?
Use a conservative rate assumption, test refinancing and include voids, repairs, tax and compliance costs. The latest mortgage rate is an input, not a promise that financing will remain available on those terms.
World Property Investor provides UK market analysis, location comparisons, rental-yield research and practical buying guidance for international investors. Visit World Property Investor to compare regions, assess deals and build a more defensible property strategy.